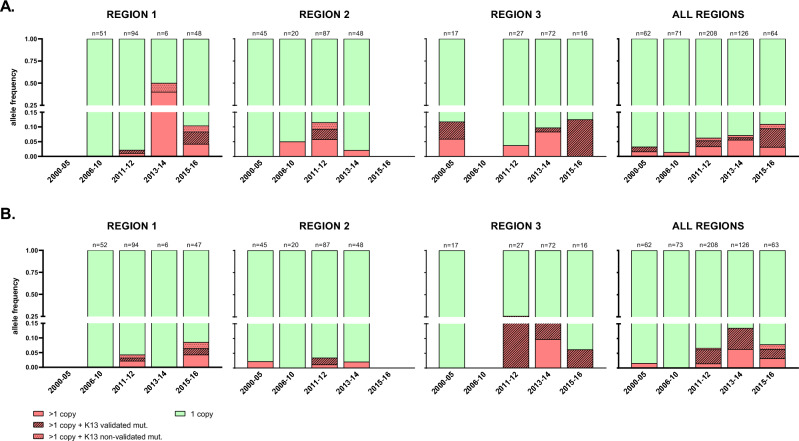
Figure 5.
Frequency of pm2 and mdr1 multiple copy numbers in Vietnam (2000–2016). Bar charts indicate the percentage of samples with multiple copies (red) or single copies (green) of pm2 (marker of piperaquine resistance; A) and mdr1 (marker of mefloquine resistance; B). Samples with multiple copies also carrying K13 mutations are indicated with different fill patterns. Data is shown by region and years. Note that the y axis in both (A,B) is split in two segments (from 0 to 0.15 and from 0.25 to 1) to improve visualization of low frequencies. Region 1: Quang Tri, Quang Nam, Gia Lai and Ratanakiri (Cambodia) provinces; Region 2: Khanh Hoa, Ninh Thuan, and Binh Thuan provinces: Region 3: Binh Phuoc province.

