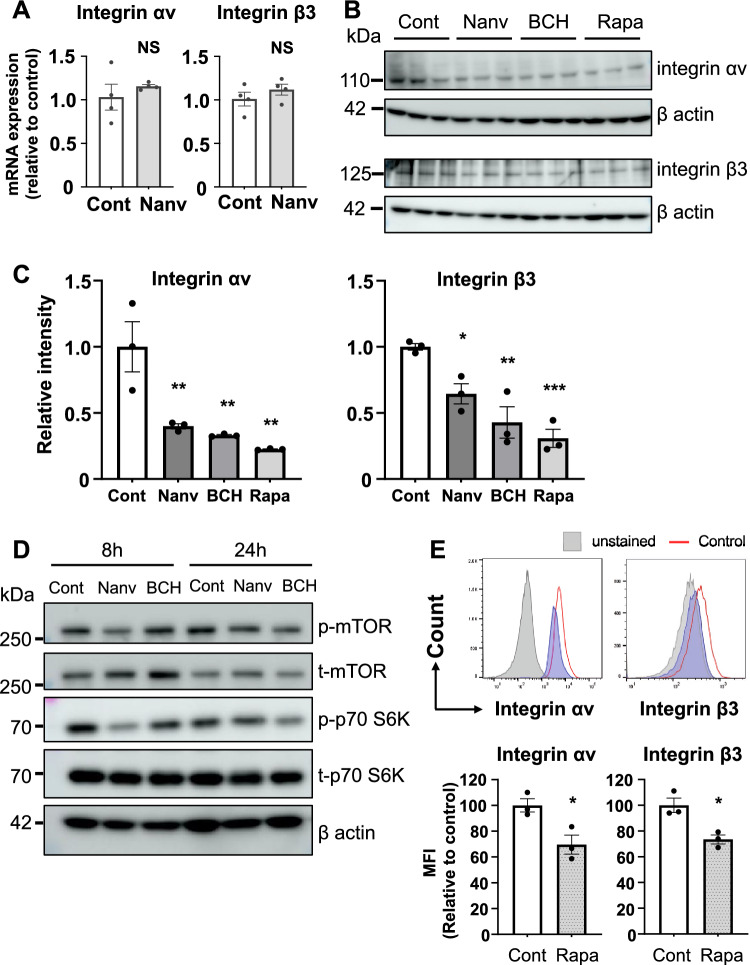
Figure 7.
Suppression of protein expression of integrin αv and β3 and downregulation of mTOR signaling pathway by LAT1 inhibitor treatment. (A) Quantification of integrin αv and integrin β3 mRNAs after nanvuranlat treatment. B16-F10 cells were treated with 30 μM nanvuranlat for 4 h. Data were normalized to the expression of GAPDH mRNA and are shown as relative expression levels compared to the untreated control. (B) Protein expression of integrin αv and integrin β3 with nanvuranlat, BCH, or rapamycin treatment. Protein levels of integrin αv and integrin β3 in B16-F10 cells after 24-h treatment with nanvuranlat (30 μM), BCH (20 mM), or rapamycin (10 nM) were analyzed by western blot. Original, uncropped electrophoretic blots are presented in Supplementary Fig. S5. (C) Quantification of the protein levels of integrin αv and integrin β3. (D) Effects of nanvuranlat and BCH on mTOR signaling pathway. Protein levels of mTOR (p-mTOR: phospho-mTOR; t-mTOR: total mTOR) and p70 S6K (p-p70 S6K: phospho-p70 S6K; t-p70 S6K: total p70 S6K) in B16-F10 cells after 8- or 24-h treatment with nanvuranlat (30 μM) or BCH (20 mM) were analyzed by western blot. Original, uncropped electrophoretic blots are presented in Supplementary Fig. S5. (E) Suppression of cell surface expression of integrin αv and integrin β3 with rapamycin treatment. Upper panel: cell surface expression of integrin αv and integrin β3. Cell surface expression of integrin αv and integrin β3 in B16-F10 cells after 24-h treatment with rapamycin (10 nM) was detected by flow cytometry. Data are represented as histograms showing fluorescence intensity (y-axis) versus cell count (x-axis). Gray-filled peaks represent unstained B16-F10 cells (without rapamycin treatment), red open peaks represent cells without rapamycin treatment, and the blue peak indicates rapamycin-treated cells. Lower panel: quantitative analysis of MFI (relative to control) of B16-F10 cells treated with rapamycin. Abbreviation: Cont: control; Nanv: nanvuranlat; Rapa: rapamycin. Statistical significance was determined using a two-tailed unpaired t-test (A and E) or one-way ANOVA followed by Tukey's post-test (C) (n = 3, NS, not significant, * p < 0.05, ** p < 0.01, *** p < 0.001). Data are mean ± SEM.

