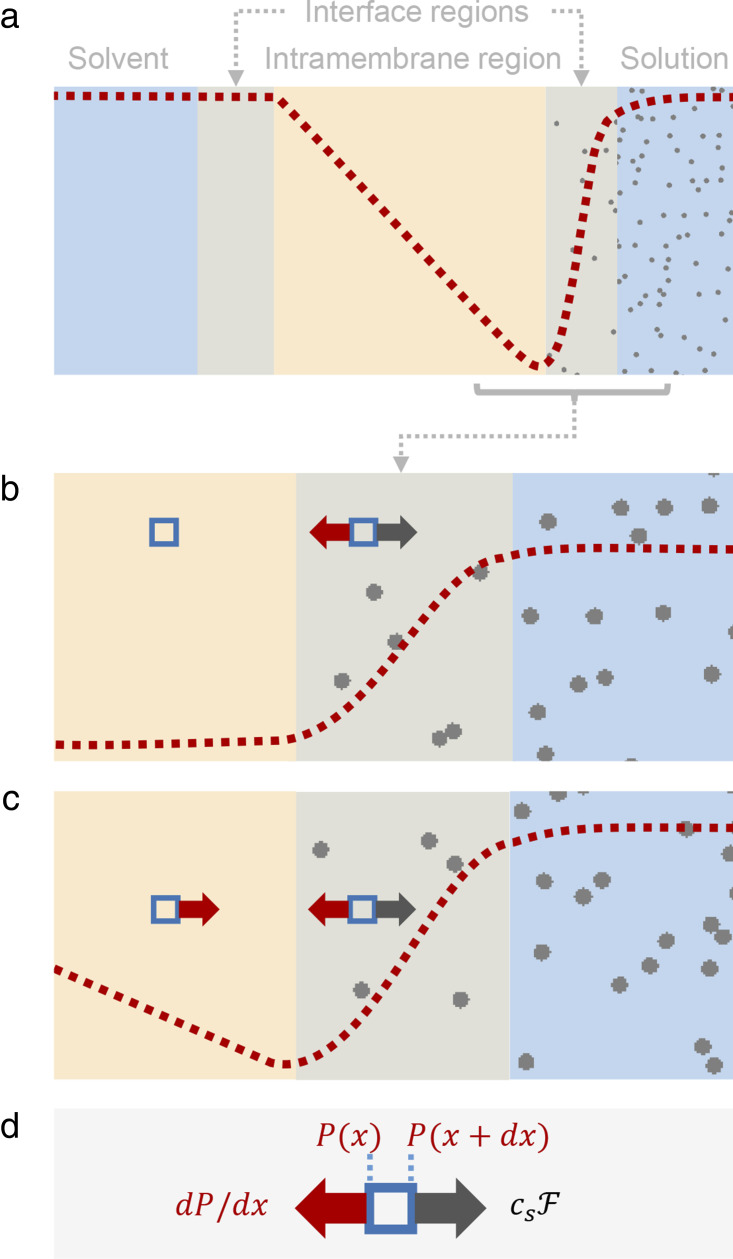
Figure 3.
An illustration of the Debye model and the Vegard pressure profile. (a) Schematic view of the cross-section of a membrane illustrating the expected pressure profile (red), with solute molecules (gray) on the right, for the osmotic steady state. (b and c) Magnified views of the solute side of the membrane–solution interface. The blue squares depict a volume element of the solution, with the expected forces shown for the case of (b) the osmotic equilibrium and (c) the osmotic steady state. (d) The forces operating on the volume elements.

