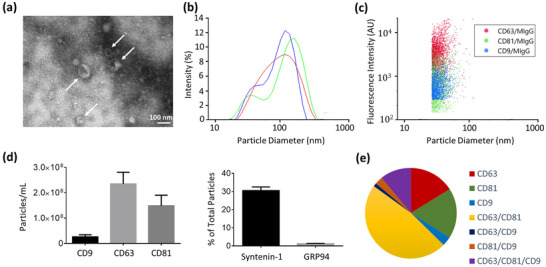
FIGURE 3.

Characterization of isolated EV‐enriched fractions. (a) Transmission electron microscopy of AMSC‐derived EV‐enriched fraction. Arrows indicate EVs with a cup‐shape morphology (magnification of 30000×; scale bar = 100 nm). (b) Dynamic light scattering of isolated EV‐enriched fraction (a representative sample with three consecutive runs), indicating a homogeneous size distribution with an average diameter of 169.6 ± 5.14 nm (average PDI of 0.24 ± 0.02). (c) A scatter plot of fluorescence intensity against diameter of particles bound to CD63 antibodies on ExoView chips, normalized to non‐specific binding of proteins bound to mouse IgG (MIgG). (d) ExoView analysis of EV surface markers (CD9, CD63, CD81), internal EV marker of Syntenin‐1 and negative marker of GRP94. (e) Colocalization pie chart for the isolated particle fractions bound to CD63 antibodies on ExoView chips, showing a significant portion of colocalized particles expressing two or more EV‐specific markers (2.3 × 10⁸ total particles bound to CD63).
