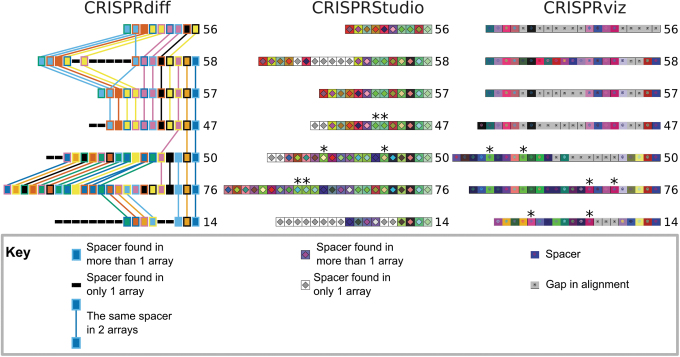
FIG. 3.
CCTK CRISPRdiff produces a clearer illustration of array relationships than the previously published tools. Cluster 2 arrays were visualized using each of the following tools: CCTK CRISPRdiff, CRISPRStudio, and CRISPRviz. The three tools all represent CRISPR spacers as colored squares and each row of colored squares represents a CRISPR array. Each spacer is assigned a unique combination of two colors; when squares with the same colors are seen in two arrays, it indicates that the spacer is present in both arrays. Below the visualization of each tool is a key describing the elements of each visualization. The leader end of each array is on the left and the trailer end is on the right. CCTK CRISPRdiff and CRISPRviz show arrays identified using MinCED, while CRISPRStudio shows arrays identified using its companion tool, CRISPRdetect. The plot produced by CRISPRStudio shows an additional spacer with 10 mismatches at the trailer end of each array that was only identified by CRISPRdetect. CRISPRStudio was run using the –gU option to assign unique spacers a gray fill color. The automatic spacer alignment function of CRISPRviz was used, followed by manual correction (gaps in the alignment are represented as gray boxes). The order of arrays in the images produced by CRISPRStudio and CRISPRviz was manually altered to correspond to the order chosen by CCTK CRISPRdiff. Array identifiers assigned by CCTK Minced are shown next to each corresponding array. “*” indicates spacers that were assigned colors with low visual contrast by CRISPRStudio or CRISPRviz.

