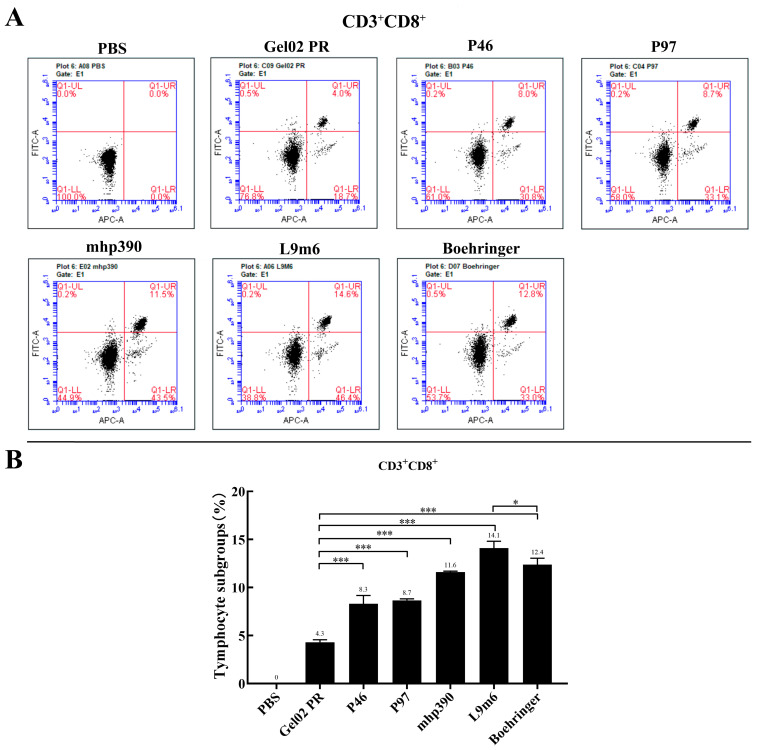
Figure 5.
Proportion of splenic CD8+ T cells measured by intracellular cytokine staining. (A) The count of CD3+, CD4+, and CD8+ T lymphocytes in the spleen was quantified by flow cytometry. Representative flow cytometric dot plot demonstrates the gating strategy employed for analyzing subsets of T lymphocytes based on forward and sidelight scatter. Dot plots exhibiting double-positive staining indicate the CD8+ T cells (Q-UR). (B) The CD8+ T cells rates in the spleen, shown as a percentage, were assessed by flow cytometry. * p < 0.05, and *** p < 0.001 indicate statistically significant differences among various groups.

