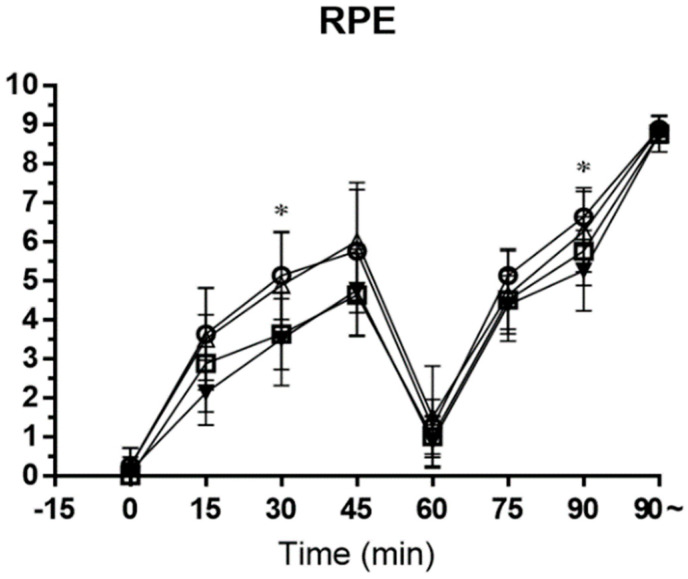
Figure 8.
−○− placebo, −□− pre-exercise, −△− half-time, and −▼− mixed. This figure shows the RPE collected during soccer-specific intermittent tests. Data are shown in means ± SD and one-way ANOVA was performed. Tukey test was used to calculate p value. Mixed test *, p < 0.05 compared with Placebo test.

