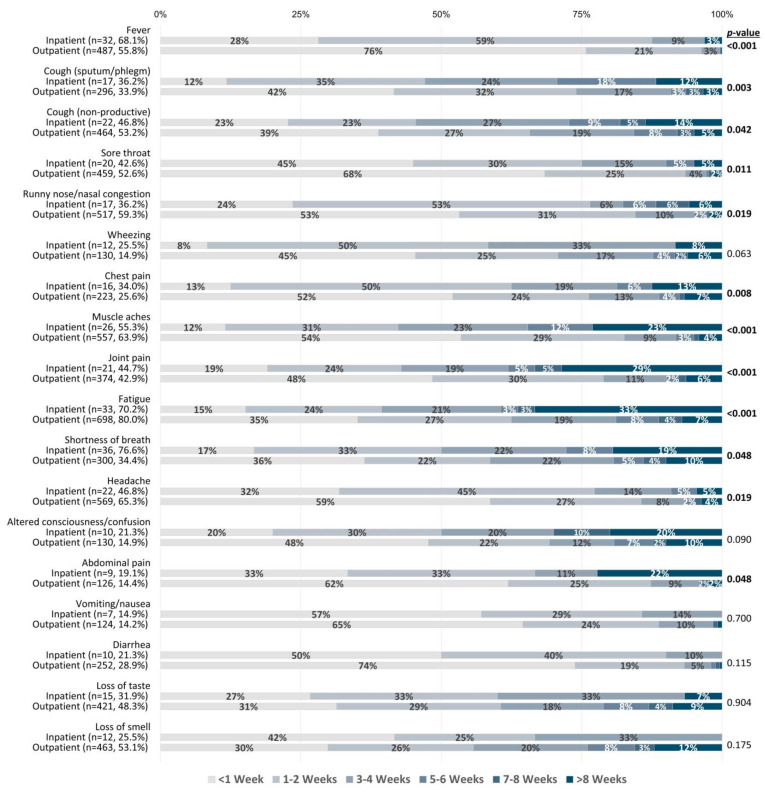
Figure 2.
COVID-19 symptom duration (in weeks) stratified by hospitalization status. Comparisons of symptom duration between patient groups were performed using the Mann–Whitney U test. Symptoms reported by >10% of each patient group were included for analysis. n values and percentages indicated below each symptom reflect the total number and proportion of participants out of each patient group who experienced a given symptom. Percentages indicated on bars represent the proportion of symptomatic participants from each patient group who reported a given symptom duration.

