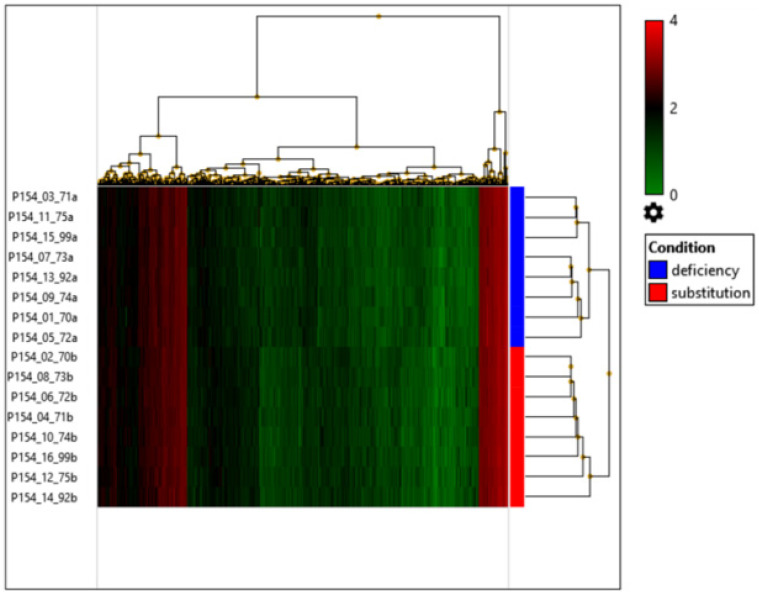
Figure 2.
Hierarchical clustering based on the expression profile of transcripts that are up- or downregulated based on p < 0.05 across the two different vitamin D levels. The color scale represents log2-transformed expression of the single gene samples. Brighter green represents lower expression and brighter red represents higher expression. No gene clusters which clearly separate the two states could be identified.

