Figure 5.
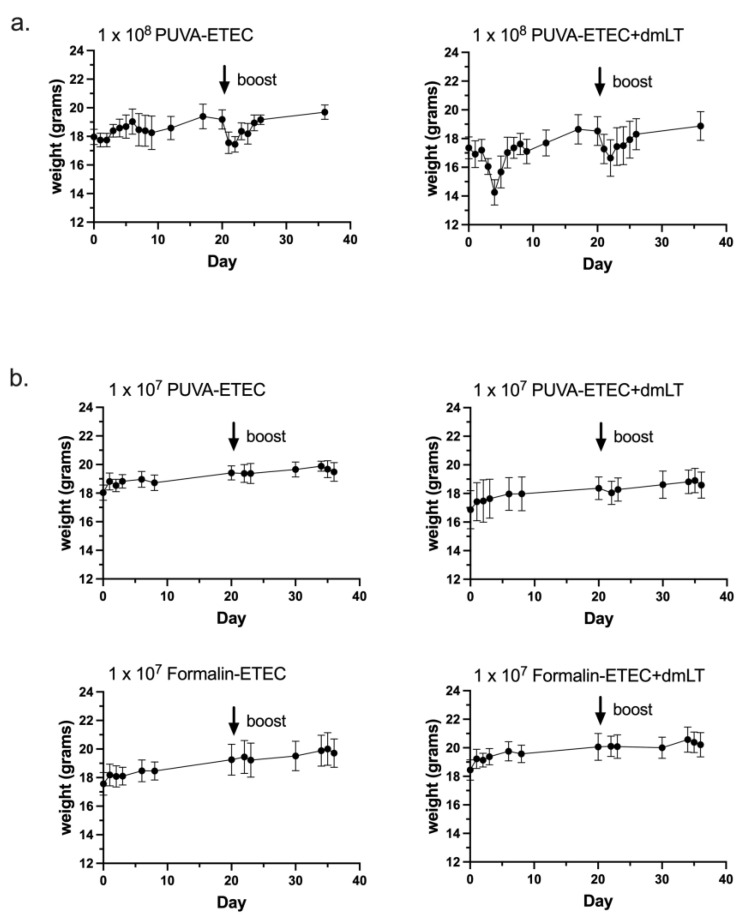
Body weight change curves after vaccination. Balb/c mice were weighed before intramuscular vaccination (time 0), and then at time points post-prime and post-boost with (a). high-dose PUVA–ETEC ± dmLT (1 × 10⁸ CFU equivalents + 0.25 µg dmLT); 1/5 mice in the high dose + dmLT group was sacrificed due to excessive weight loss; (b). low-dose PUVA–ETEC or formalin–ETEC ± dmLT (1 × 10⁷ CFU equivalents + 0.25 µg dmLT); points represent mean ± s.d. from 7 or 8 mice per group.

