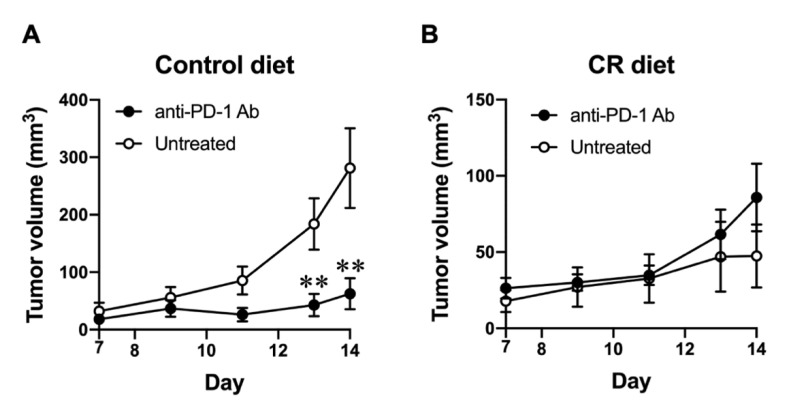
Figure 2.
Effect of CR on the responsiveness to immune checkpoint blockade. (A,B) B16-OVA tumor size progression in control-diet-fed (A) and CR-diet-fed (B) C57BL/6J mice with/without anti-PD-1 antibody treatment (0.2 mg/mouse i.p.) at days 3, 6, and 9 from day 0. Each plot represents the mean ± SEM (n = 4–21); ** p < 0.01, compared with control-diet-fed mice or antibody-untreated group; indicated p values were obtained from a statistical comparison, the unpaired two tailed t-test (Student’s t-test).

