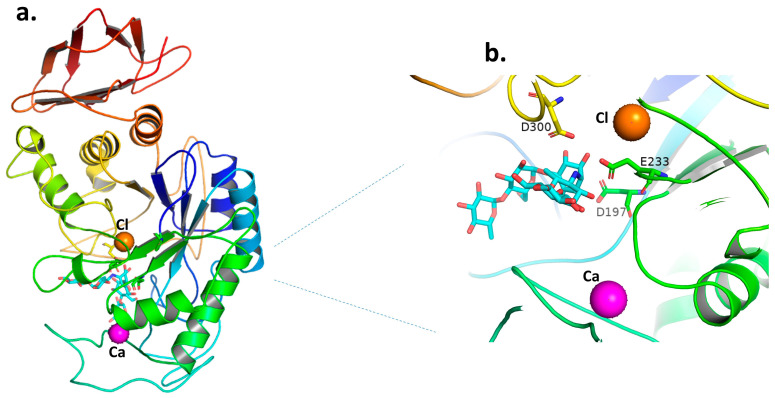
Figure 3.
(a) The structure of the human pancreatic α-amylase/acarbose complex is depicted as a ribbon diagram. The chloride and calcium ions are represented as orange and magenta spheres, respectively, in (a,b). (b) The active site of the human pancreatic α-amylase/acarbose complex; residues located within a 4-A° radius of acarbose are represented as sticks (the catalytic triad of D197-D300-E233). The acarbose, shown as sticks in (a,b), is colored cyan. From the structure, (a,b) were adopted with PDB entry code 1B2Y [48] and produced using PyMol [47].

