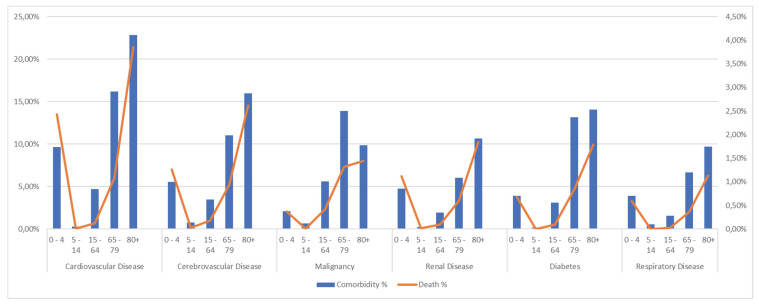
Figure 1.
Overall distribution for five age classes (0 to 4, 5 to 14, 15 to 64, 65 to 79, and over 80) of comorbidity (left axis and blue bar) and in-hospital mortality (right axis and orange line). The graph represents the most common comorbidities in our sample, coded according to the Charlson index.

