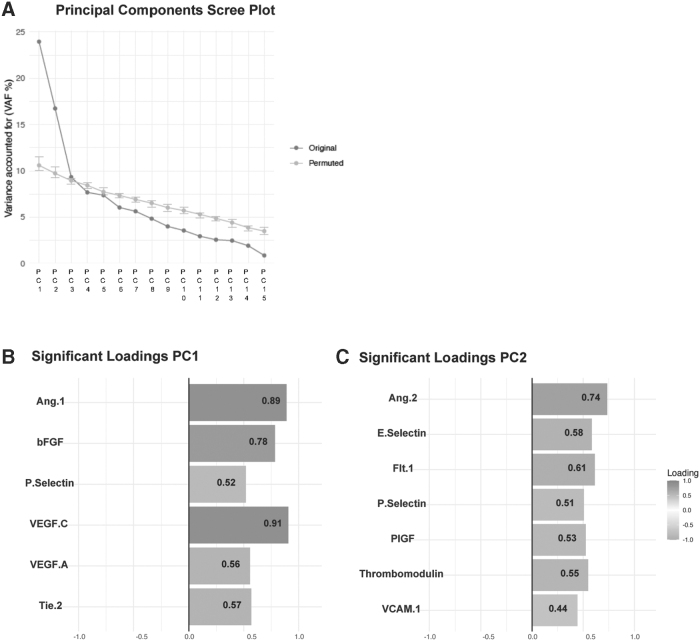
FIG. 3.
Principal components analysis. (A) Scree plot showing variance accounted for by each orthogonal component. The first principal component (PC1) accounted for 23.9% of the variance and the second principal component (PC2) accounted for 16.7% of the variance. (B) The subset of vascular biomarkers included in PC1 that were significant (p < 0.05) after permutation testing. (C) The subset of vascular biomarkers included in PC2 that were significant (p < 0.05) after permutation testing.

