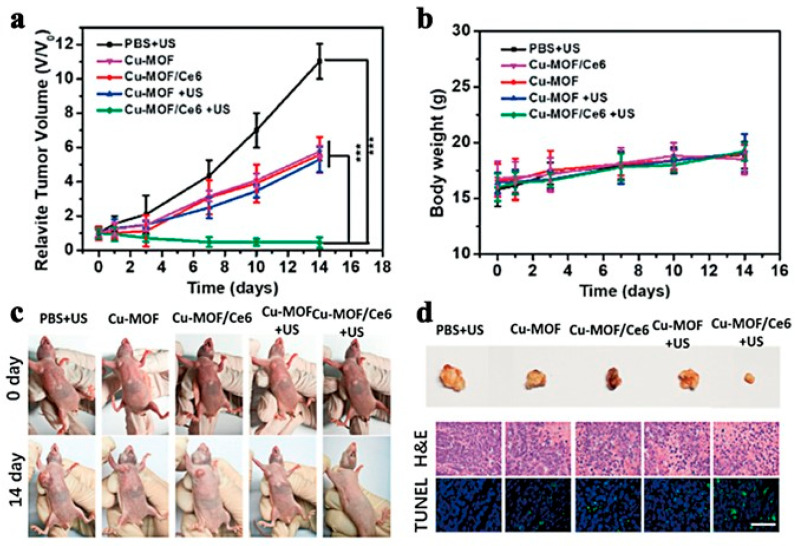
Figure 26.
(a) Relative volumes of tumor and (b) weight of body of mice received various treatments. (c) Photographs of tumor-bearing mice before various treatments and after 14 days. (d) Photographs of tumors harvested after 14 days post-treatment. H&E staining and TUNEL staining of tumor sections from multiple groups. Scale bar: 200 μm. *** p < 0.001. Reproduced with permission from ref. [113] (copyright 2020, Zhang).

