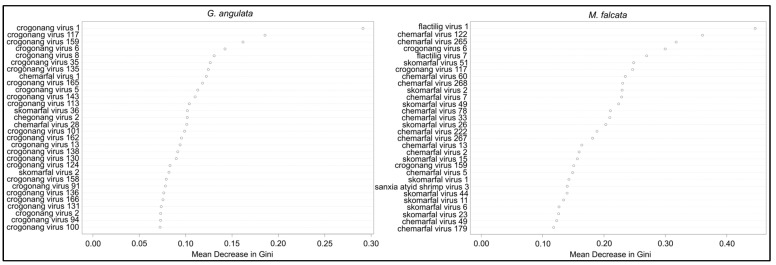
Figure 4.
Random forest variable importance plots based on the contributions of individual viruses in distinguishing cases from control mussels. Importance is based on the mean decrease in the Gini coefficient associated with each virus. Plot on the left is for the G. angulata dataset, while the plot on the right is for the M. falcata dataset. For both species, only a few viruses were substantially more important than others, while the majority of viruses had relatively equal contributions to the model.

