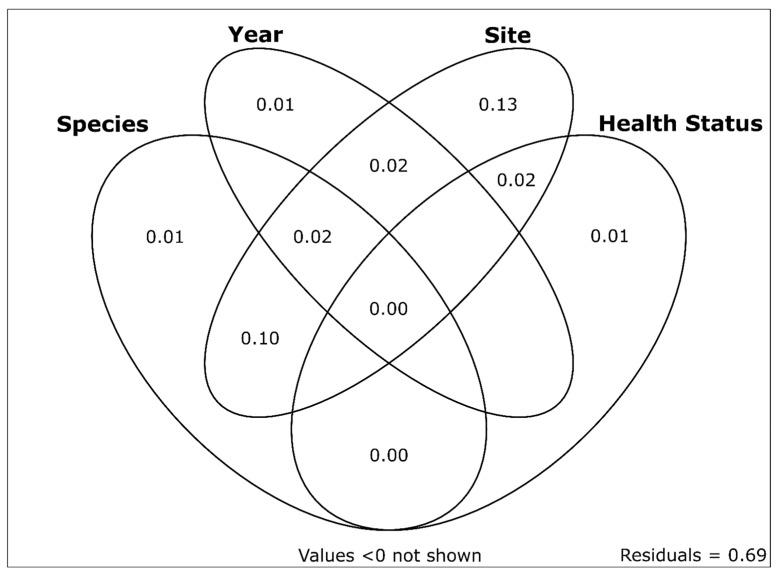
Figure 7.
Variation partitioning plot showing the proportions of unique and shared variation in western US freshwater mussel viromes explained by sample site, sampling date, species, and health status. Numbers represent adjusted R2 values. Sample site was the only variable with a substantial proportion of unique variation explained (13.1%). Sample site and mussel species explained the only other substantial fraction of shared variation (10.2%).

