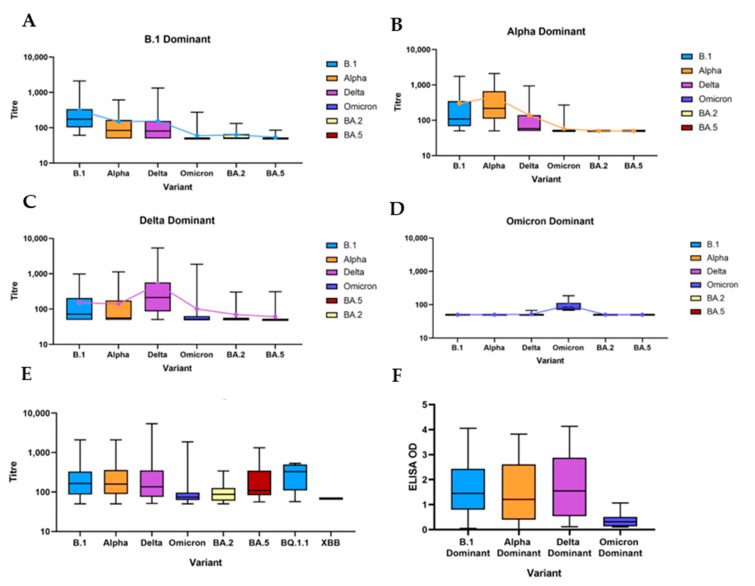
Figure 3.
(A) Boxplot of B.1 dominant samples showing median neutralisation titres against different variants. The blue line shows the mean titre against each variant. (B) Boxplot of Alpha dominant samples showing median neutralisation titres against different variants. The orange line shows the mean titre against each variant. (C) Boxplot of Delta dominant samples showing median neutralisation titres against different variants. The purple line shows the mean titre against each variant. (D) Boxplot of Omicron dominant samples showing median neutralisation titres against different variants. The blue line shows the mean titre against each variant. (E) Boxplot showing median neutralisation titres against different variants from every neutralising positive sample. (F) Boxplot showing the median ELISA OD values of each group of variant dominant samples.

