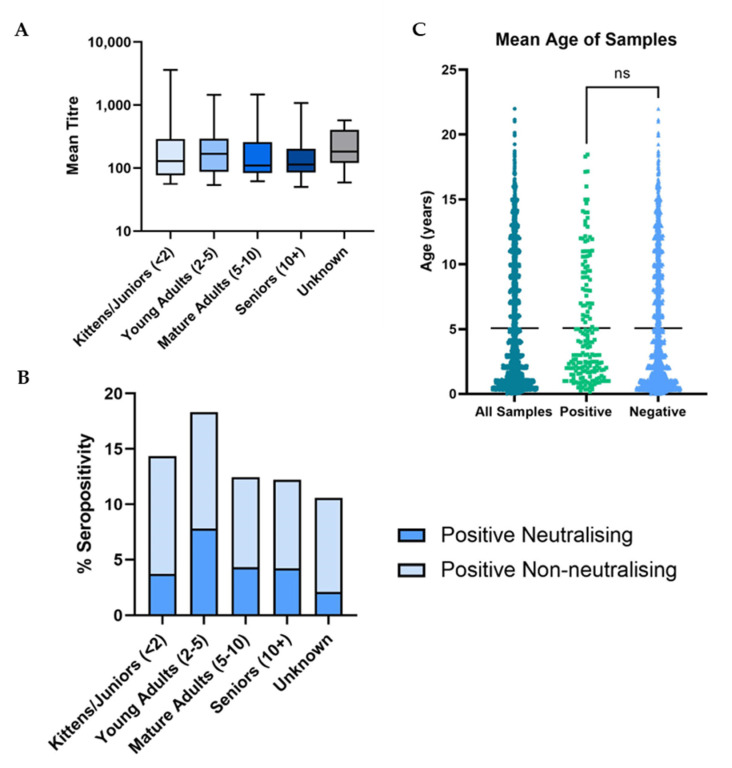
Figure 6.
(A) Boxplot showing the mean neutralising titre of samples from cats in different age groups. (B) Bar graph showing total % seropositivity in different age groups. The darker bars show neutralising seroprevalence and the lighter stacked bars show non-neutralising seroprevalence. (C) Scatterplot showing the mean age of sampled cats. Mean age is shown as a black line. There was found to be no significant difference in mean age of cats with positive and negative results (p = 0.12).

