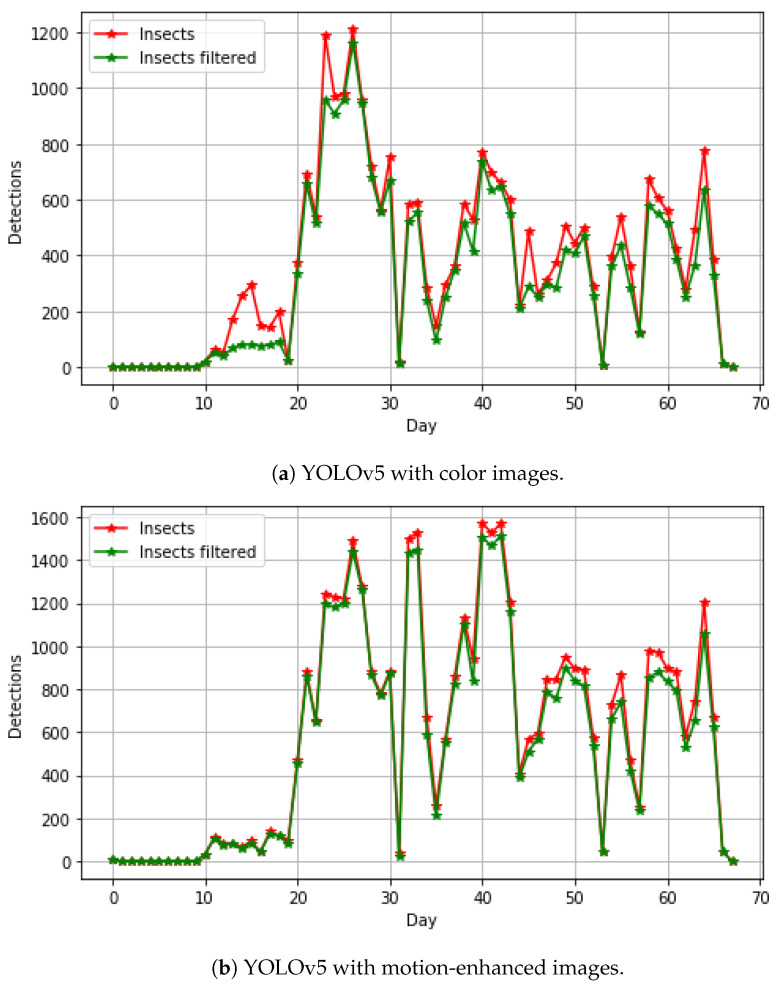
Figure 4.
The abundance of insects from the two-month monitoring period of flowers and insects. A two minute filter is used to remove detections at the same spatial position in the time-lapse image sequence. The red and green curves show the non-filtered and filtered detections, respectively. The difference between the curves indicates false predictions or an insect detected at the same position within two minutes.

