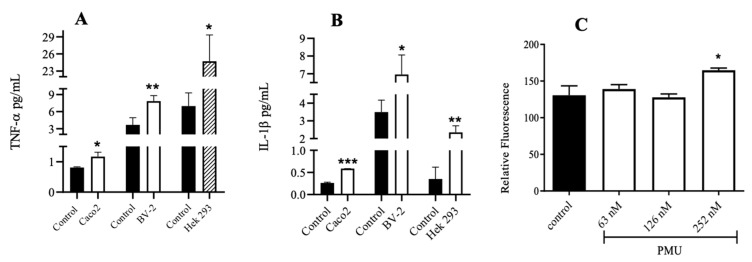
Figure 8.
Effect of P. mirabilis urease (PMU) on cell lines. The cell cultures were incubated with NaPB 7.5 (control) or PMU (63, 126, and 252 nM) at 37 °C for 6 h. The production of cytokines was measured in the culture’s supernatant via ELISA. In (A), the TNF-α levels induced by PMU 63 nM (white bars) or 126 nM (hatched bar). In (B), the IL-1β levels induced by PMU 252 nM (white bars). The results are expressed in pg/mL. In panel (C), Hek 293 cells grown in Transwell inserts were treated for 1 h with PMU, then the medium was changed to a solution containing FITC-Dextran (1 mg/mL). After 30 min, the presence of FITC-Dextran in the lower compartment was evaluated fluorometrically (495 nm/530 nm). The results are expressed as the FITC-Dextran relative fluorescence intensity. The analyses were performed via one-way ANOVA followed by Tukey’s post hoc test. The results are expressed as the mean ± SEM (n = 3–4, per group). * p < 0.05, ** p < 0.01 and *** p < 0.001 vs. controls. Data on the cytokine levels in the Hek 293 and BV-2 cells were adapted from Grahl et al. (2021) [13].

