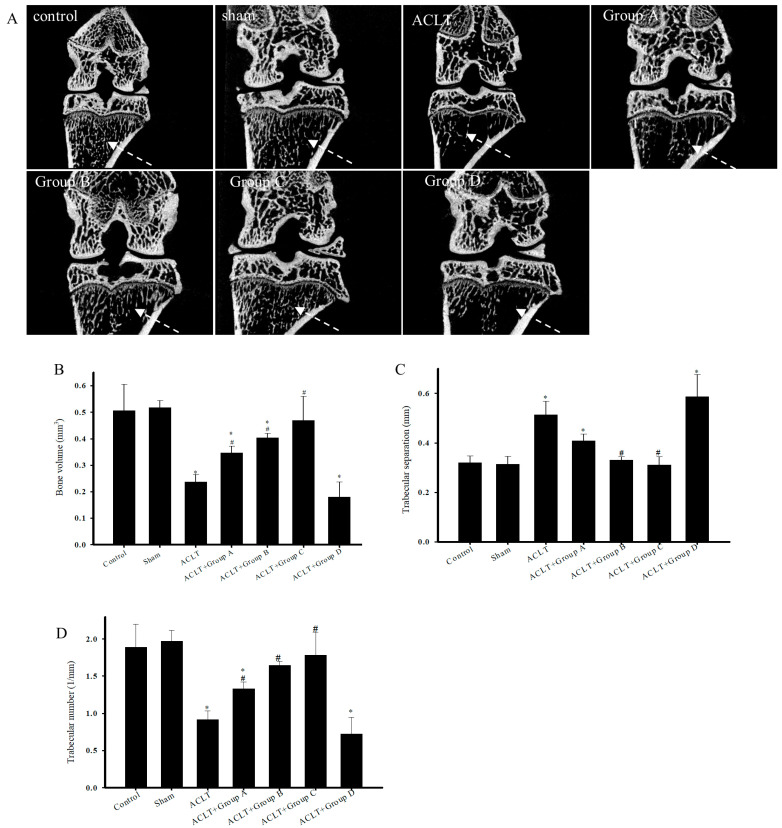
Figure 2.
Micro-CT scans of Reconstructed Images of Cancellous Bone and Quantitative Analysis. Micro-computed tomography (micro-CT) was used to analyze the structure of the knee tibia in ACLT after treatment. (A) 2D micro-CT scans of reconstructed images of cancellous bone. Dotted arrows indicate image sections for comparing cancellous bone volume. Quantitative analysis of (B) bone volume (mm3), (C) trabecular separation (mm), and (D) trabecular number (1/mm). Data are presented as mean ± standard error of the mean. * denotes comparison with sham group (p < 0.05); # denotes comparison with ACLT group (p < 0.05).

