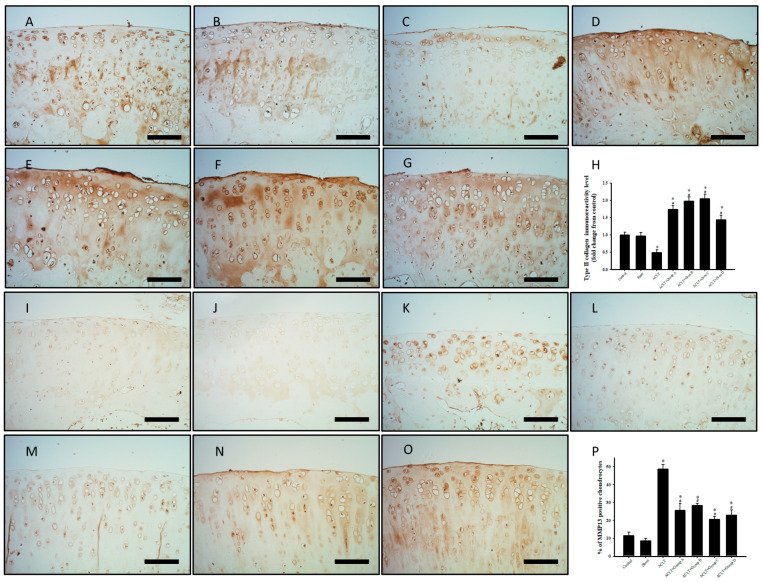
Figure 5.
Expression of C-II and MMP-13 in Cartilage Tissue with ACLT after Treatment. (A,I) indicate control group; (B,J) indicate sham group; (C,K) indicate ACLT group; (D,L) indicate group A; (E,M) indicate group B; (F,N) indicate group C; and (G,O) indicate group D. (A–G) Immunohistochemical staining of type II collagen (C-II; brown area) in knee joint sections. (H) Quantitative analysis of C-II expression in cartilage. (I–P) Immunohistochemical staining of MMP-13 in joint sections. Brown areas indicate immunoreactive cells. (P) Quantitative analysis of MMP-13–positive cells in cartilage. Scale bar =100 μm. Data are presented as mean ± standard error of the mean. * denotes comparison with sham group (p < 0.05); # denotes comparison with ACLT group (p < 0.05).

