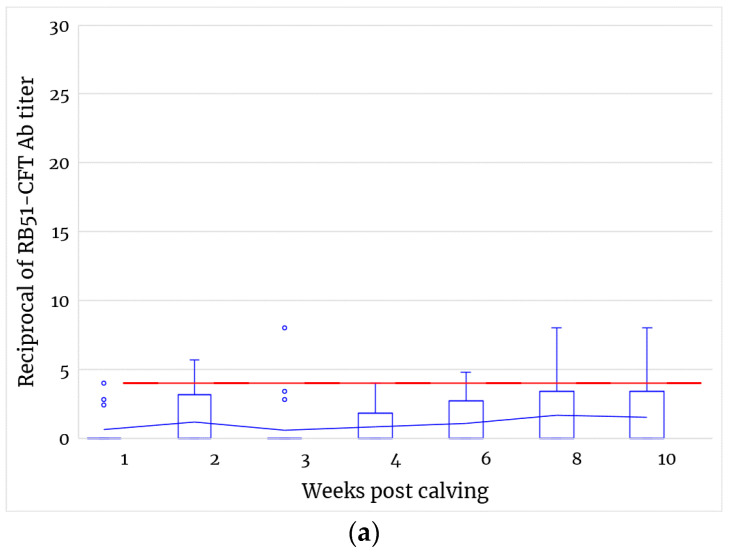
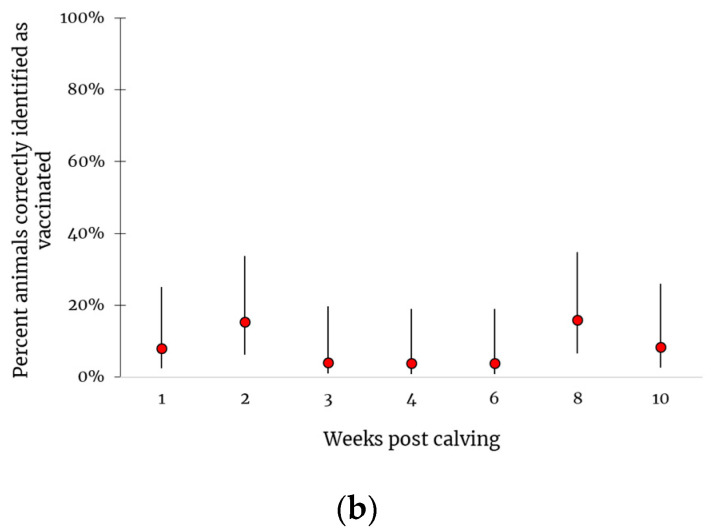
Figure 4.
(a) RB51-CFT antibody titers observed after calving and during lactation. Values are expressed as reciprocal of serum dilutions. The box and whisker chart shows distribution RB51-CFT data into quartiles. Lines inside the boxes indicate group median value. Outliers are displayed as blue circles. The blue line indicates the mean of grouped values from vaccinated animals. The red line shows the test cut-off (1:4). Non-parametric Mann–Whitney test was applied to compare Ab titers between vaccinated and control groups. No significant differences were observed between vaccinated and control animals. Data from control group are not displayed and remained constantly below the cut-off value. (b) Percentage of animals testing positive to RB51-CFT after calving and during lactation. Results are expressed as the percentage of vaccinated animals resulting positive to RB51-CFT (Ab titer ≥ 1:4) over the number of vaccinated animals tested for each time point. Bars indicate upper and lower confidential limits calculated at 95% confidence interval using a Bayesian approach with a beta distribution.


