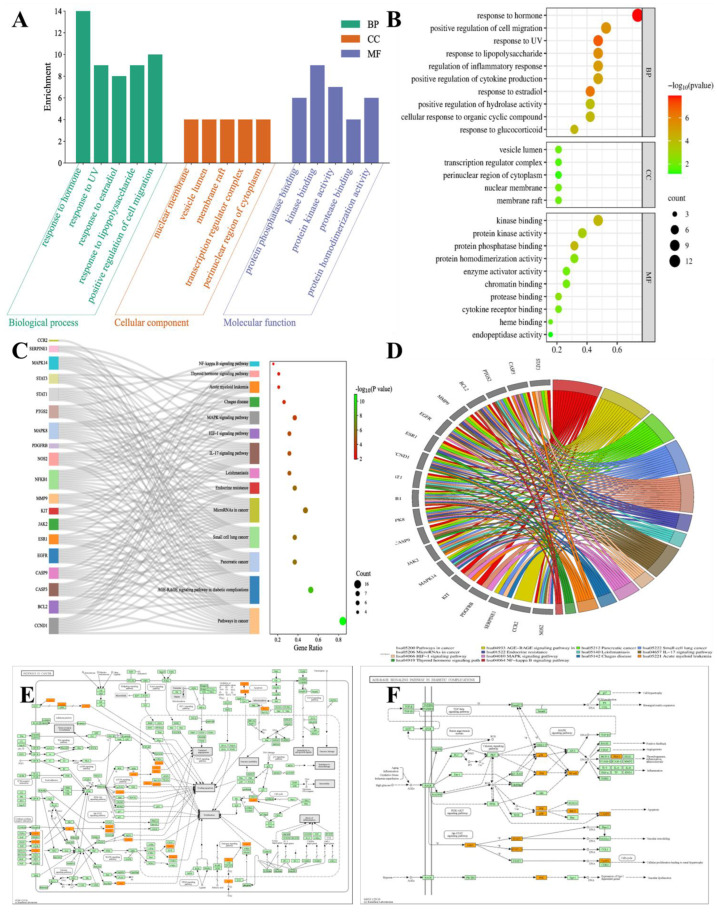
Figure 14.
(A) Top 5 of GO enrichment analysis for biological process, cellular components, and molecular functions.; (B) Bubble plot of GO enrichment; (C) Sankey and dot plot of KEGG pathway enrichment analysis illustrating 8 enriched pathways; (D) Gene ontology chord diagram of KEGG pathway analysis; (E) Pathways in cancer were colored using the KEGG mapper. (F) AGE-RAGE signaling pathway in diabetic complications were colored using the KEGG mapper. Orange represents the therapeutic targets in this pathway where the four core herbs act to alleviate psoriasis.

