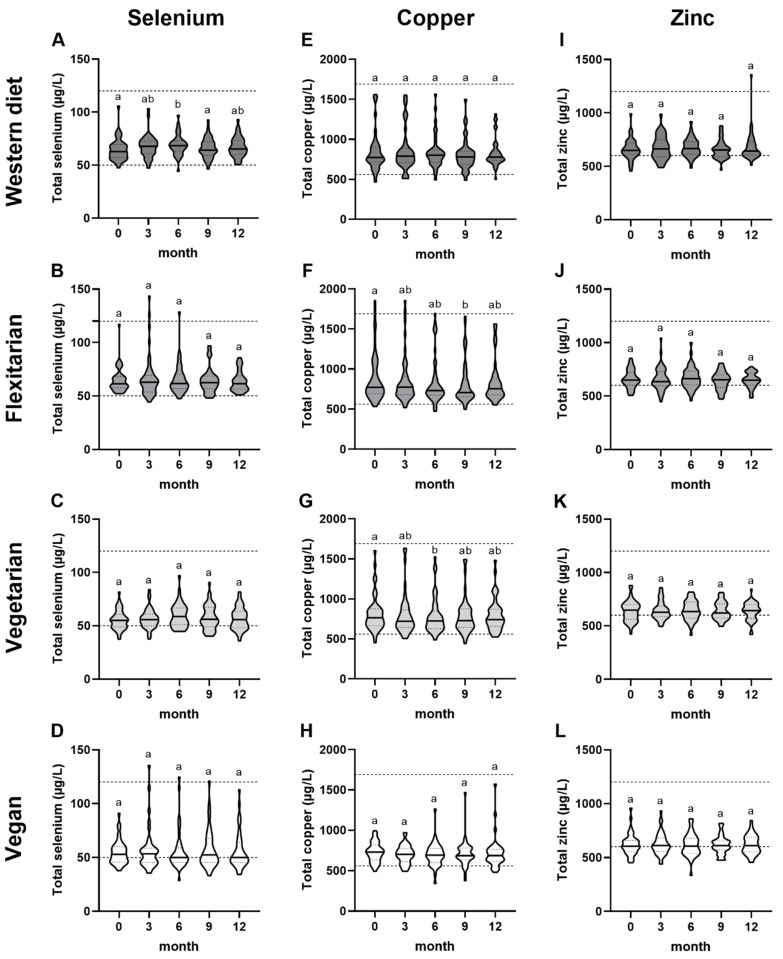
Figure 4.
Comparison of trace element concentration during the study according to dietary pattern. (A–D) Total selenium, (E–H) total copper and (I–L) total serum zinc concentrations of omnivores (WD, n = 40), flexitarians (Flex, n = 47), vegetarians (VG, n = 45), and vegans (VN, n = 40) were determined using total reflection X-ray fluorescence spectroscopy (TXRF). The dashed lines indicate the reference ranges of serum trace element levels. The number 0 on the X-axis represents the baseline. The results are shown as median with 25- and 75-quartile range (indicated as dotted lines). Diet groups that do not share indices (a,b) differ significantly (Friedman test followed by Benjamini–Hochberg correction (p < 0.05)).

