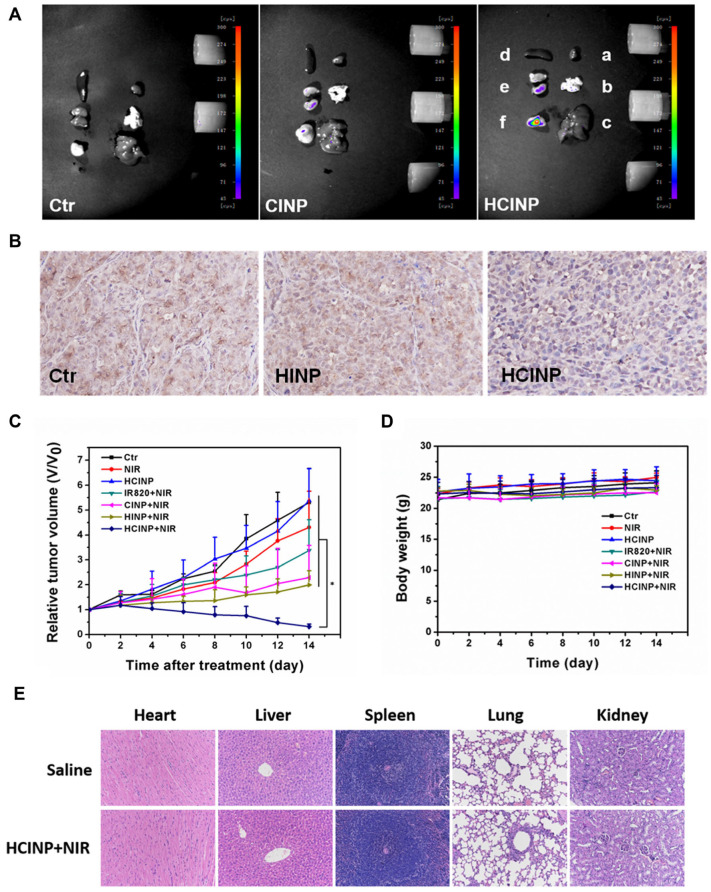
Figure 11.
Enhanced antitumour effect of HCINPs. (A) Measurement of the in vivo targeting effect of HCINPs (a: heart, b: lung, c: liver, d: spleen, e: kidney, f: tumour). (B) Expression of HIF-1α in tumour tissues (200×). The mean positive area of the control group, HINP group, and HCINP group were 1522, 1503, and 1092, respectively. (C) Relative tumour volume curves of different groups of MV3 tumour-bearing mice. * p < 0.05, versus the HCINP group. (D) Body weights of mice measured during the 14 observation days in different groups. (E) HE-staining images of major organs collected from the saline (Normal) and HCINPs with NIR irradiation groups (200×). Reproduced from ref. [170].

