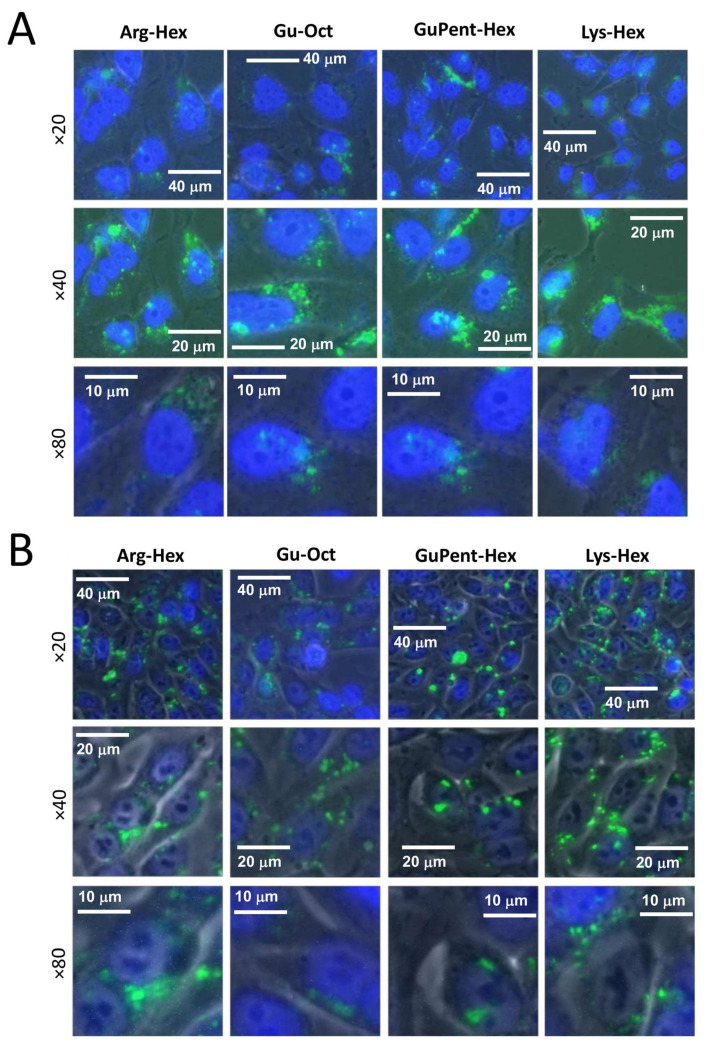
Figure 7.
Images of fluorescence-labelled mature miRNA transfected cells. (A) U251 cells (B) HT29 cells. Cell nucleus is marked with Hoechst 33342 dye and taken using DAPI filter (461 nm), while miRNA is represented by green spots and acquired using FITC filter (530 nm). Three different magnifications are reported, ×20, ×40, and ×80.

