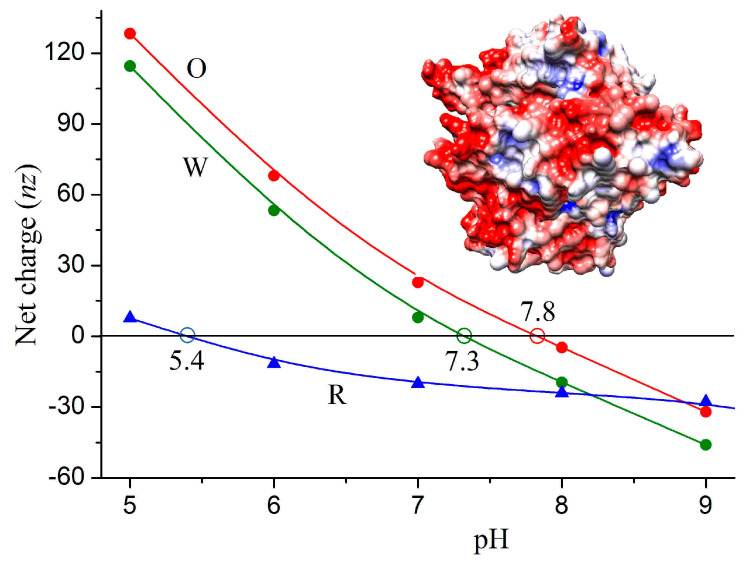
Figure 3.
pH dependences of the net charge nz of 3D structures (native conformation) of the ACE2 human cell receptor (blue curve R) and trimers of the S-protein of the wild-type strain (green curve W) and the omicron variant (red curve O) of the SARS-CoV-2 coronavirus. Insert: Virus-binding surface of the ACE2 protein whose electric potential at pH 6.5 is colored in red (negative) and blue (positive).

