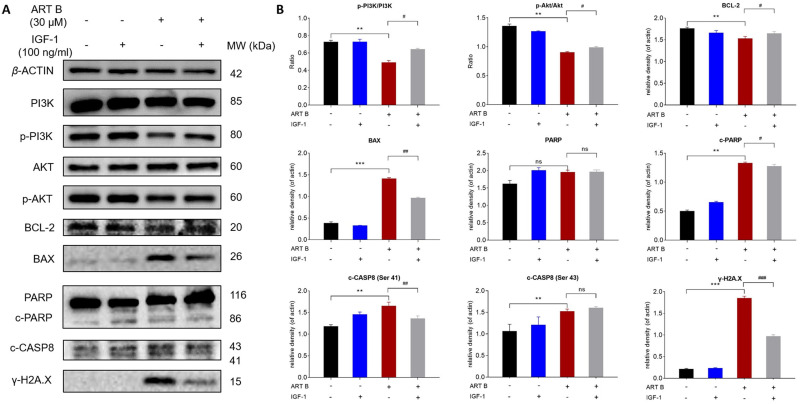
Figure 10.
IGF-1 reversed ART B-induced apoptosis in H1299 cells. Cells were treated with ART B (30 μM) with or without IGF-1 (100 ng/mL) for 24 h. (A) The expression of PI3K, p-PI3K, Akt, p-Akt, BCL-2, BAX, PARP, c-PARP, c-CASP8, γ-H2A.X in H1299 cells were detected by Western blotting. (B) The statistical analyses of the related protein expressions. β-ACTIN was used as an internal control. Data are presented as mean ± SD (n = 3), **P < 0.01, and ***P < 0.001 vs control group. #P < 0.05, ##P < 0.01, and ###P < 0.001 vs the ART B treatment group. ns, P > 0.05 vs control group or the ART B treatment group.

