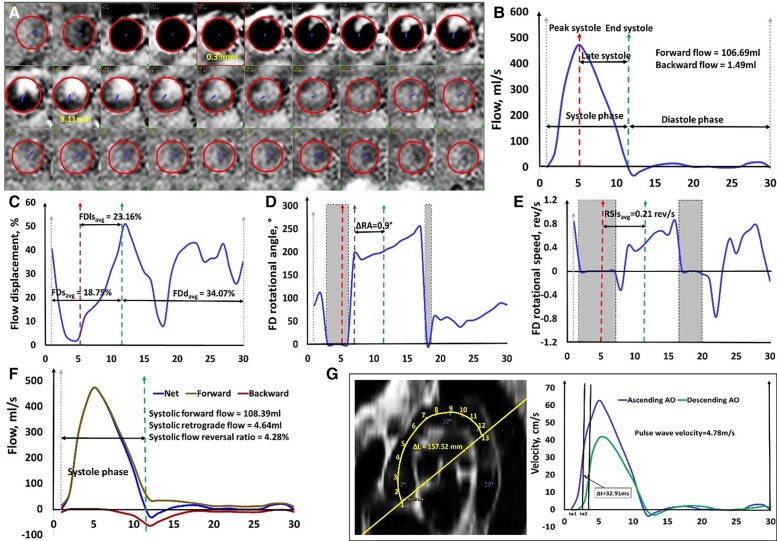
Figure 1.
Illustration of two-dimensional aortic flow parameter calculations. (A) Segmentation of aorta for whole cardiac cycle in two-dimensional phase-contrast magnetic resonance imaging. The borders were segmented on the reconstructed magnitude images and copied onto the phase images; (B) Aortic flow curve with illustrations of peak systole, late systole, systole, and diastole phase; (C) Flow displacement curve; (D) Flow displacement rotational angle curve; (E) Flow displacement rotational speed curve; (F) Flow reversal ratio curve; (G) Three-dimensional aortic arch length between ascending and descending aorta by reconstructing the aortic arch using bright-blood sequence, and pulse wave velocity by the half-maximum method. The grey areas denoted flow displacement ≤12% and were excluded in the calculations of rotational angle and rotational speed. The unit of the x-axis in each figure is the frame number.

