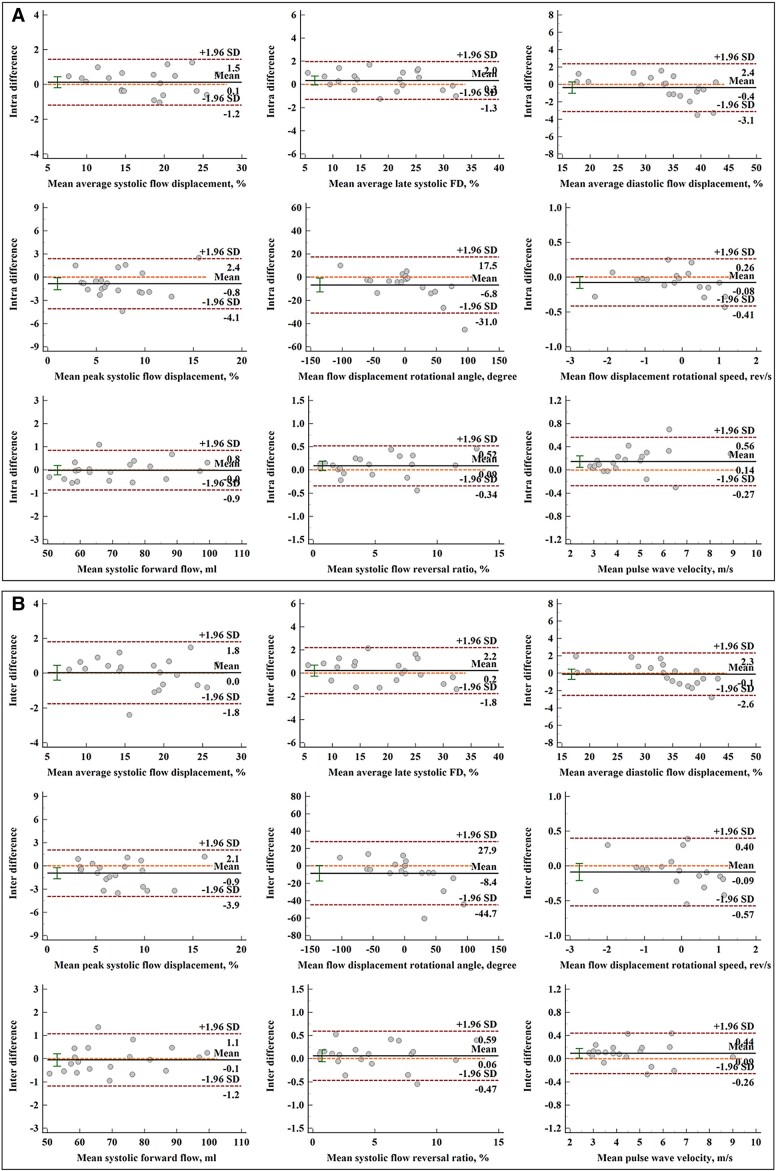
Figure 6.
Bland–Altman plots for aortic blood flow components. (A) Bland–Altman analysis of intraobserver repeated measurements; (B) Bland–Altman analysis of interobserver repeated measurements. From left to right, top to bottom: average flow displacement during systole, late systole and diastole, peak systolic flow displacement, rotational angle, rotational speed, systolic forward flow, systolic flow reversal ratio, and pulse wave velocity.

