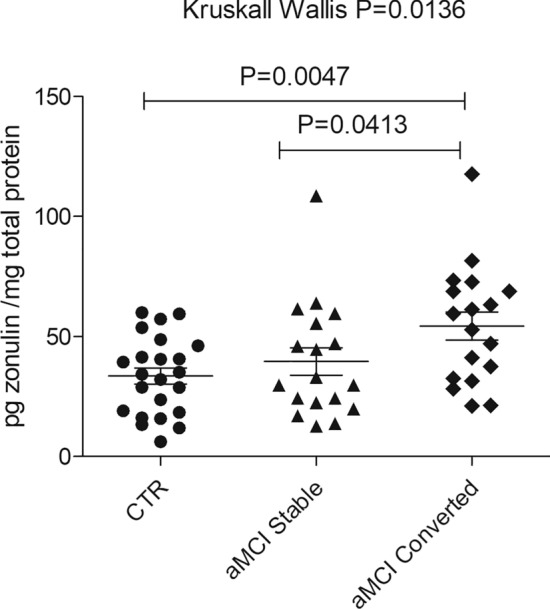
Fig. 3.

Serum zonulin levels as predictors of progression from aMCI to dementia. Zonulin concentration for each patient was measured using Cusabio ELISA assay and expressed as pg zonulin/mg total proteins. Zonulin values were reported as mean ± SE. Zonulin levels were determined in a control group (CTR; 33.5 ± 3.4 pg zonulin/mg total proteins ± SE), and two subsets of aMCI patients. The first group represents aMCI (39.6 ± 5.7 pg zonulin/mg total proteins ± SE); the second includes patients that evolved to AD, i.e., progressing from an original aMCI (54.4 ± 5.8 pg zonulin/mg total proteins ± SE). Differences in zonulin levels among groups were evaluated using the Kruskal–Wallis test (p = 0.0136) coupled with Dunn’s Multiple Comparison as a post-test. The difference between CTR and progressed aMCI was p = 0.0047; the difference between stable vs. progressed aMCI was p = 0.0413
