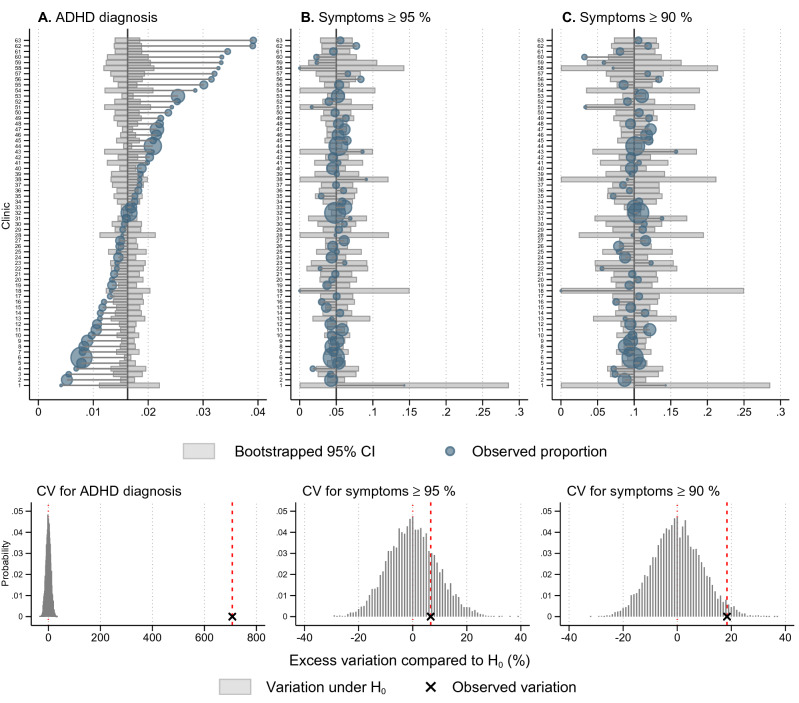
Fig. 2.
ADHD diagnosis incidence rate, ADHD symptoms ≥ 95% and ≥ 90% by clinics (n = 63), 2011–2016. Upper graphs in Panel (A–C) present bootstrapped 95% confidence intervals (CI) for chance variation around the population-weighted grand mean (black vertical line) for diagnosis, and sample-weighted grand mean for symptoms. Observed proportions (blue circles) outside 95% CI are larger than expected by chance. The lower graphs in Panel (A–C) present the observed coefficient of variation (CV) and the expected values of CV, under the null hypothesis that the CV does not exceed chance variation, based on 10,000 draws. The x-axis is the excess variation in CV compared to E(CV | H0)

