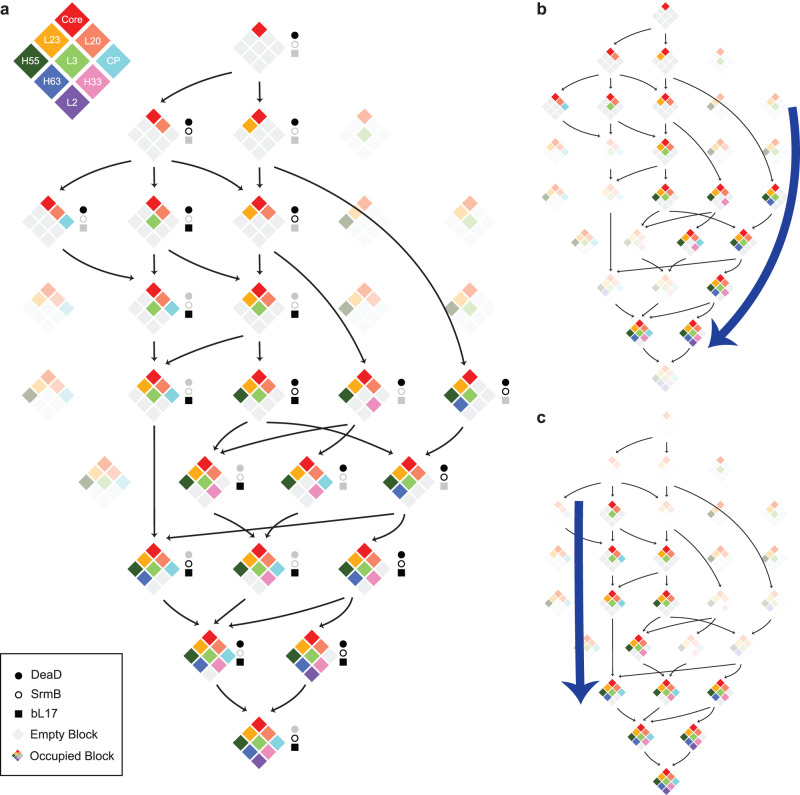
Fig. 4. Schematic comparison of assembly pathways.
a From the block dependencies in Fig. 3b, 29 possible intermediates are arranged from top to bottom, based on increasing block number. Intermediates observed within the datasets are shown in color, and unoccupied blocks are shown in gray. The presence of an intermediate in ∆deaD, ∆srmB, or bL17-depletion datasets is indicated by black closed circles, open circles, and squares, respectively. There are eight combinations consistent with the block dependencies that are not observed, indicated by faded intensities. Arrows connect the nearest precursors, with disassembly not allowed, requiring the assembly core as the parent node. Display of intermediate found in ∆deaD (b) and bL17-depletion (c) datasets. Blue bold arrows highlight the change in flux through the same set of intermediates in the different datasets. (See SI for the ∆srmB intermediate pathway, which is similar to ∆deaD).

