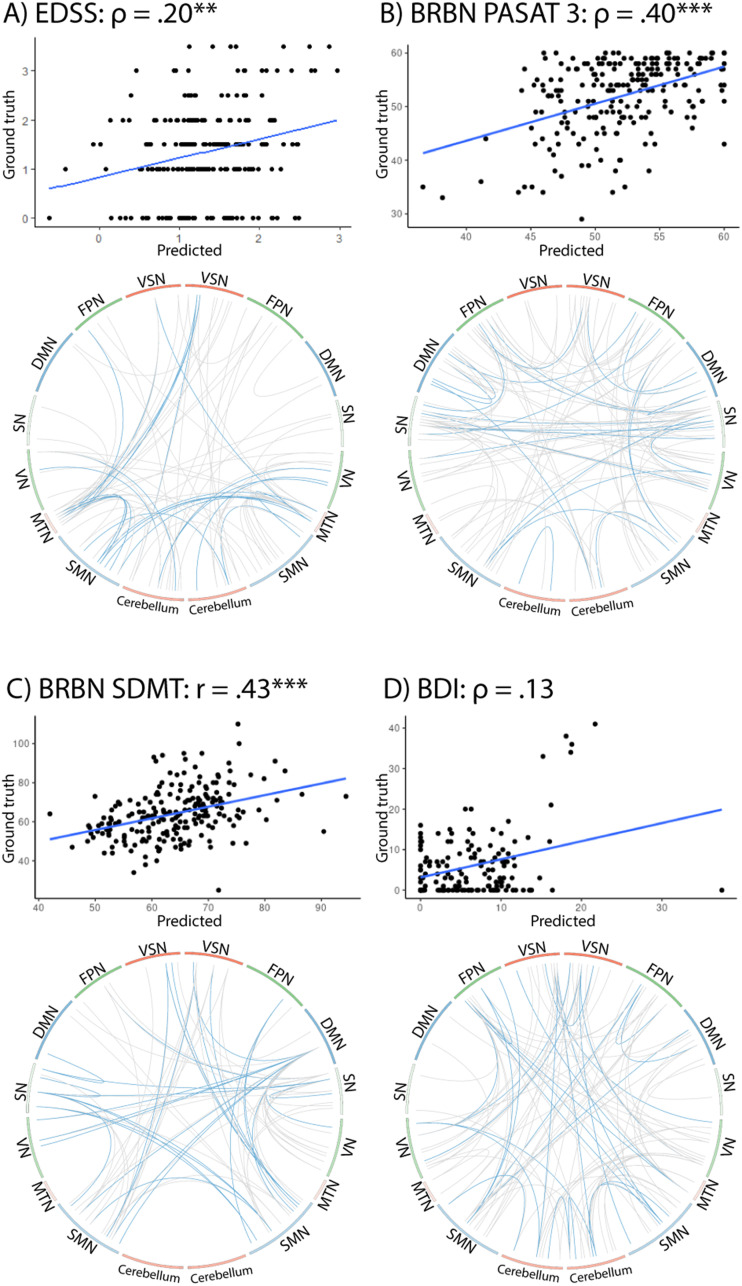
Figure 7.
Connectivity patterns associated with the prediction of disability status and behavioural variables. For each variable, we visualize (top) the relation between a subject's predicted value and the ground truth in the corresponding task, computed with a Leave-One-Out-Cross-Validation (LOOCV) linear model (Correlation values are marked according to their significance: ** p < 0.01; *** p < 0.001) and (bottom) the edges that were used during the computation of the linear model, based on their high correlation with the outcome variable in the test data. Blue lines show edges selected in at least 80% of cross-validation flds, grey lines show edges selected at least once. For EDSS, PASAT3 and SDMT, we observed clear patterns and significant predictions, whilst BDI prediction was non-significant and edges more distributed.

