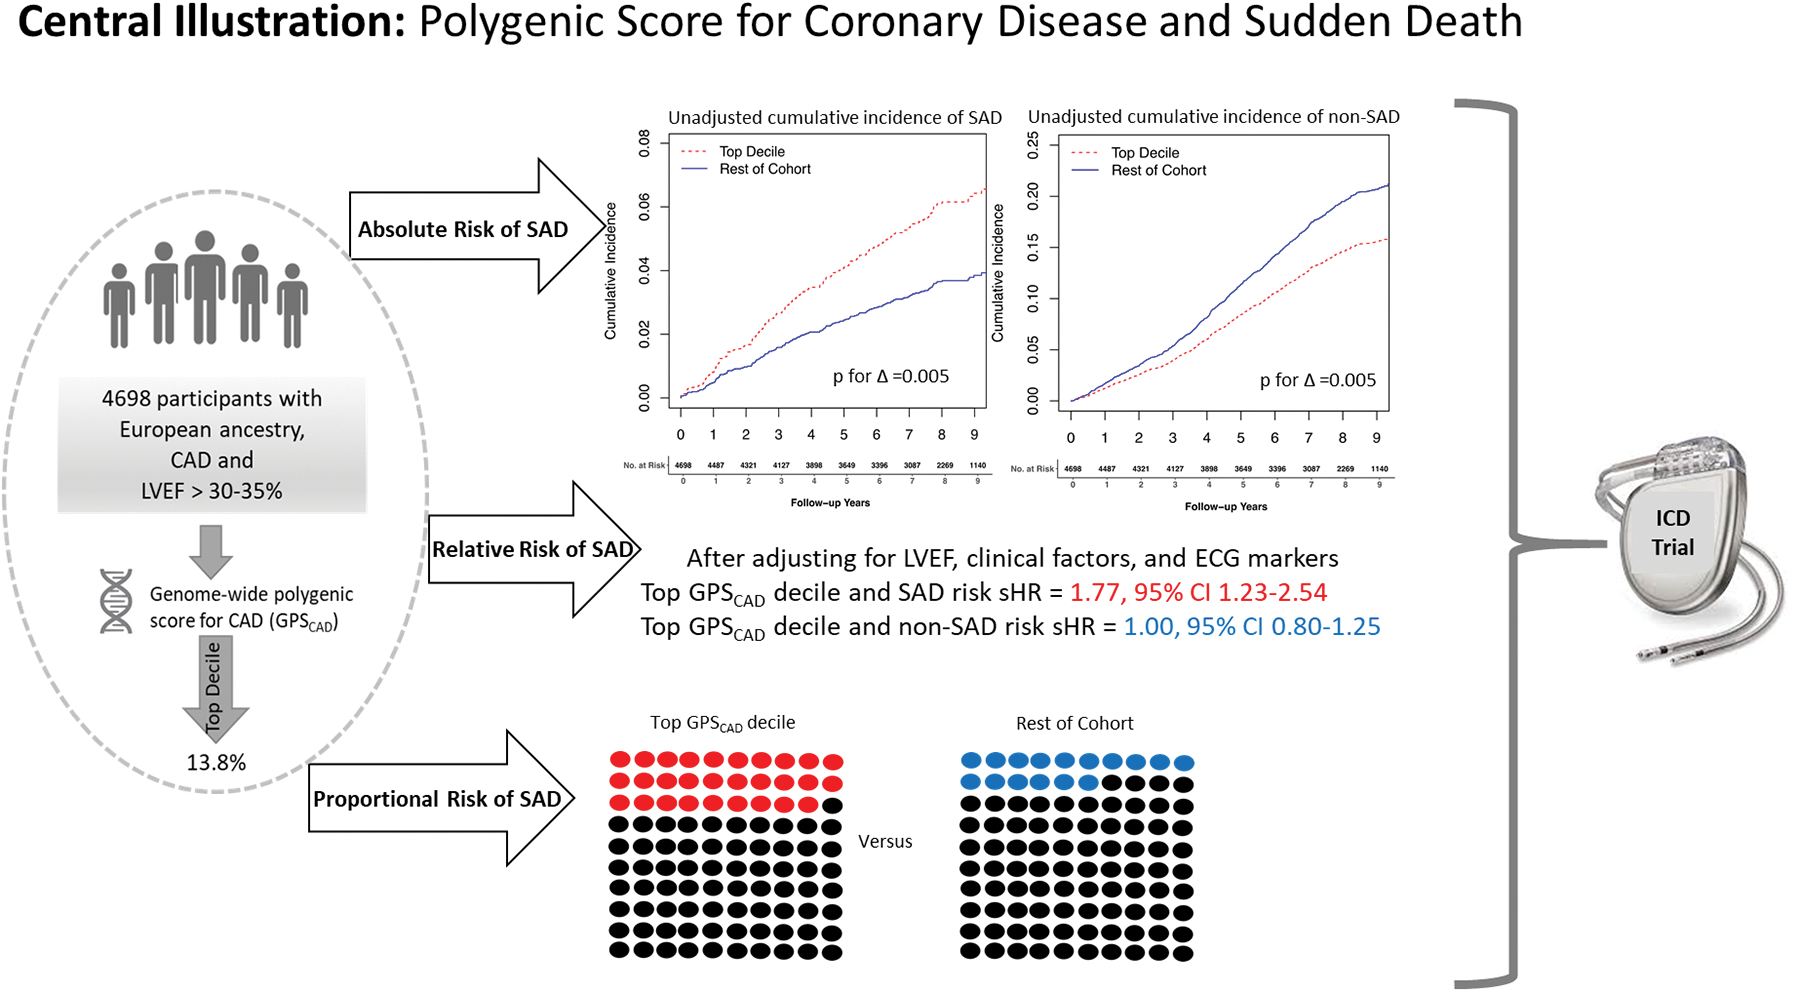
Central Illustration.

Unadjusted cumulative incidence of SAD and non-SAD. The red line represents top GPSCAD decile and the blue line represents the rest of the cohort. In panel A, the unadjusted cumulative incidence of SAD over the study period, accounting for competing deaths, was significantly greater in the top GPSCAD decile compared to the rest of the cohort. In panel B, the unadjusted cumulative incidence of non-SAD, accounting for competing deaths, was significantly lower in the top GPSCAD decile as compared to the rest of the cohort. GPSCAD decile = genome-wide polygenic score for coronary artery disease, non-SAD = non-sudden and non-arrhythmic death, SAD = sudden and/or arrhythmic death.
