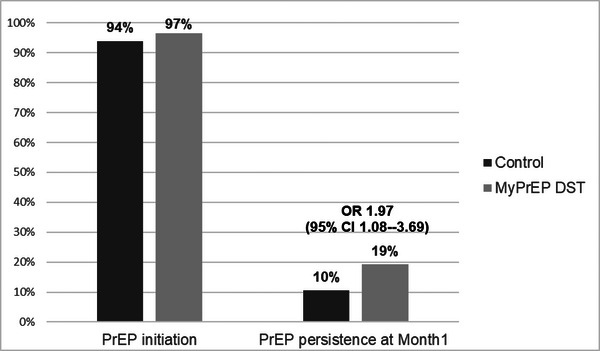
Figure 1.

PrEP initiation and persistence, by study group. The histograms indicate the proportion of women randomized to the control condition (dark bars) and the My PrEP decision support tool (light bars) who received a PrEP prescription in the left histograms, and who attended their month 1 visit and received a PrEP refill in the right histograms.
