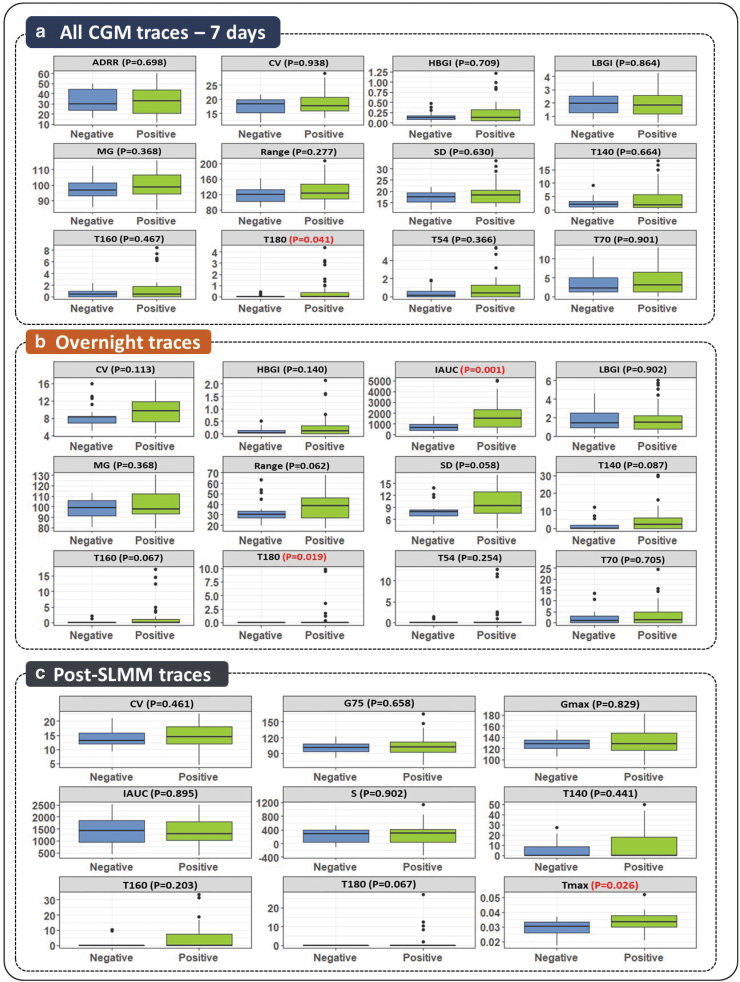
FIG. 3.
Characterization of CGM data through different glycemic features in different scenarios. (a) Boxplots for 12 different glycemic features extracted from the entire 7 days of CGM traces for 60 participants in two different groups of autoantibodies (Ab+/Ab−). (b) Boxplot for 12 features extracted from overnight (i.e., 12:00–06:00) CGM traces for 60 participants in two different groups of Ab. (c) Boxplots for 9 features extracted from 75-min post-SLMM CGM traces for 53 participants in two different groups of Ab. A significance level of 5% (P-value <0.05) was considered significant to distinguish between the different groups of Ab (P-value highlighted in red).

