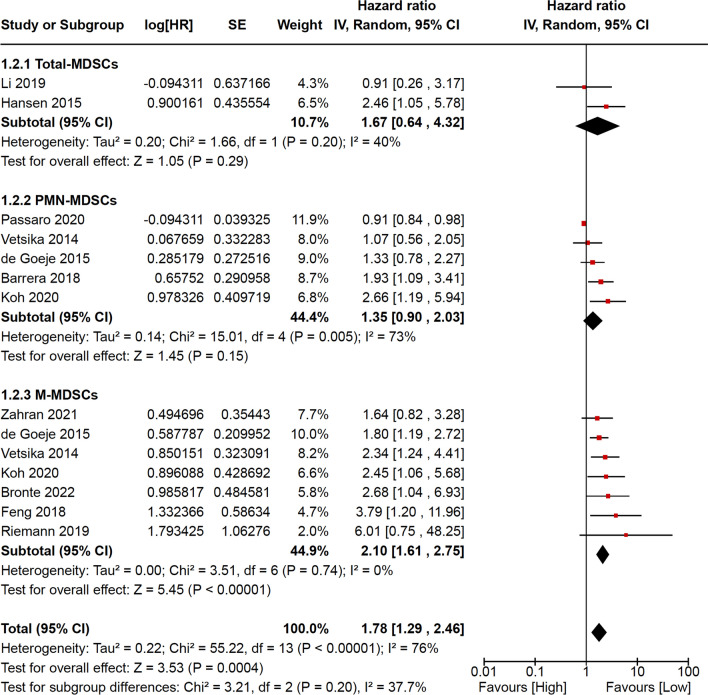
Fig. 3.
Meta-analysis results for overall survival are reported as forest plot, including logarithm of hazard ratio, standard error, weight, hazard ratio with relative 95% confidence intervals for each study. Weight and hazard ratio with relative 95% confidence intervals are reported for pooled analyses (subtotals and total). MDSCs myeloid-derived suppressive cells, PMN polymorphonuclear, M monocytic, log[HR] logarithm of hazard ratio, SE standard error, IV instrumental variables, CI confidence intervals; df degrees of freedom, P p-value, I2 heterogeneity statistic I2, Z z-test

