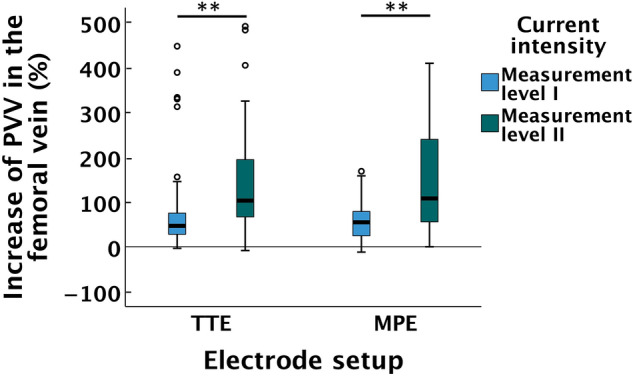
Fig. 5.

Hemodynamics in the femoral vein. Percentual increase of PVV from baseline to ML I and ML II for the TTE and MPE setups. In the boxplot, the length of the box represents IQR, and error bars represent min–max and in case of outliers 1.5xIQR. Circles represents outliers. The black line within boxes represents median. **Indicates a difference with p < 0.001. PVV peak venous velocity, ML measurement level, TTE transverse textile electrode, MPE motor point electrode
