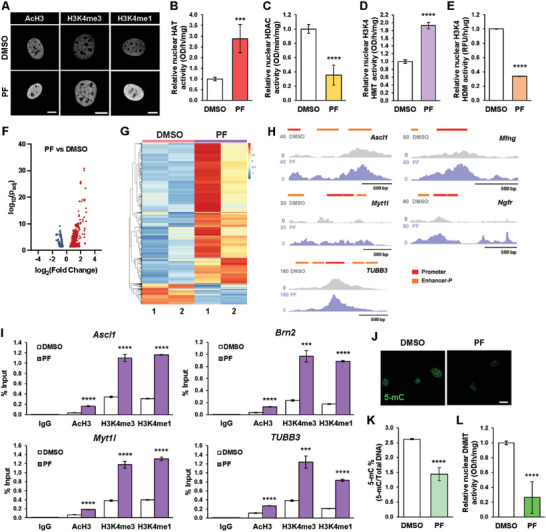
Figure 7.

Focal adhesion kinase inhibition modulates the epigenetic state to enhance iN reprogramming. A) Representative images of histone modifications in non‐transduced fibroblasts after treatment with 5 µm PF573228 for 2 h. Scale bar, 10 µm. B) Quantification of histone acetyltransferase (HAT) activity in fibroblasts treated with DMSO or 5 µm PF573228 for 2 h (n = 5). Significance determined by two‐tailed, unpaired t‐test, compared to DMSO condition. C) Quantification of histone deacetylase (HDAC) activity in fibroblasts treated with DMSO or 5 µm PF573228 for 2 h (n = 5). Significance determined by two‐tailed, unpaired t‐test, compared to DMSO condition. D) Quantification of H3K4‐specific histone methyltransferase (HMT) activity in fibroblasts treated with DMSO or 5 µm PF573228 for 2 h (n = 3). Significance determined by two‐tailed, unpaired t‐test, compared to DMSO condition. E) Quantification of H3K4‐specific histone demethylase (HDM) activity in fibroblasts treated with DMSO or 5 µm PF573228 for 2 h (n = 3). Significance determined by two‐tailed, unpaired t‐test, compared to DMSO condition. F) Volcano plot showing differential accessible regions in PF‐treated fibroblasts relative to DMSO‐treated fibroblasts, as determined by ATAC‐seq. Red dots indicate regions with increased chromatin accessibility while blue dots represent regions with decreased accessibility. G) Heatmap representation of differentially accessible regions in fibroblasts treated with DMSO or PF573228 for 2 h, as determined by ATAC‐seq. Each row represents a differential region; each column is one biological replicate of the indicated condition. H) ATAC‐seq tracks for Ascl1, Myt1l, TUBB3, Mfng, and Ngfr genomic loci from fibroblasts treated with DMSO or 5 µm PF for 2 h, highlighting promoter and proximal enhancer (Enhancer‐P) regions. I) ChIP‐qPCR analysis shows the percent input increase of histone modifications at the promoter regions of Ascl1, Brn2, Myt1l, and TUBB3 in BAM‐transduced fibroblasts cultured with DMSO or 5 µm PF573228 at day 3 (n = 3). Significance determined by two‐tailed, unpaired t‐test, compared to DMSO condition. J) Representative images of 5‐mC expression in non‐transduced fibroblasts treated with 5 µm PF573228 for 24 h. Scale bar, 20 µm. K) Quantification of percentage of methylated DNA (5‐mC) in total DNA from DNA samples of fibroblasts cultured in the absence and presence of PF573228 for 24 h (n = 4). Significance determined by two‐tailed, unpaired t‐test, compared to DMSO condition. L) Quantification of DNA methyltransferase (DNMT) activity in fibroblasts treated with DMSO or 5 µm PF573228 for 2 h (n = 5). Significance determined by two‐tailed, unpaired t‐test, compared to DMSO condition. Bar graphs show mean ± standard deviation (***p < 0.001, ****p < 0.0001).
