Figure 4.

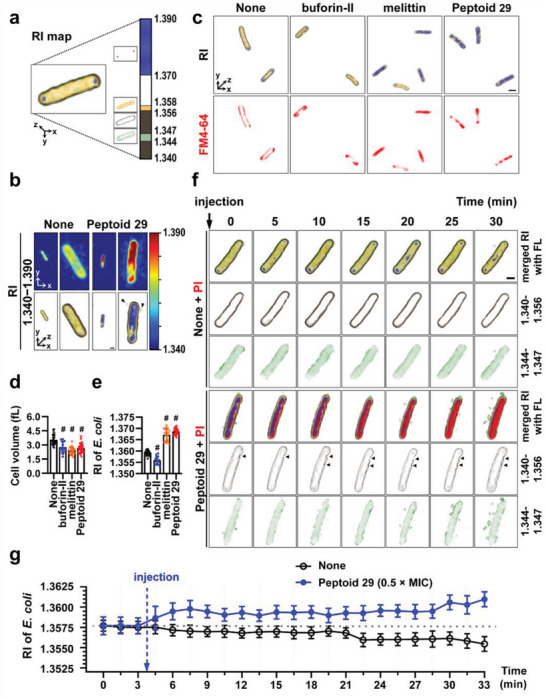
Effects of peptoid 29 on the membrane of E. coli ATCC 25922. a) False‐color reconstructed image of E. coli based on RI‐dependent segmentation masks. The color bar indicates 3D‐rendered RI distribution range (from 1.340 to 1.390). b) 2D and 3D‐reconstructed images with the RI distribution of untreated or 29‐treated (4 × MIC) E. coli at 30 min. c) Representative 2D fluorescence and 3D RI distribution images of untreated (control), buforin‐II (25 µM), melittin (25 µM), or 29 (4 × MIC)‐treated E. coli with FM 4–64 (10 µg mL−1) at 30 min. Quantitative analysis of d) cell volume and e) mean RI for each group: none (n = 29), buforin‐II (n = 13), melittin (n = 19), and 29 (n = 28). Comparison of different groups was performed using unpaired and two‐tailed t‐test. # means p < 0.001. All values were presented as mean ± SD. f) Representative time‐lapse 3D‐rendered images of untreated or 29 (4 × MIC)‐treated E. coli shown at 5 min intervals over 30 min. Images were overlaid with corresponding fluorescence images treated with propidium iodide (PI) (10 µg mL−1). Black arrowheads point at sites of membrane damage. Scale bar: 1 µm. g) Quantitative analysis of time‐lapse monitoring for mean RI values of control or 29 (0.5 × MIC)‐treated E. coli at 1.5 min intervals over 30 min. Sample numbers were: control (n = 22) and 29 (n = 13).
