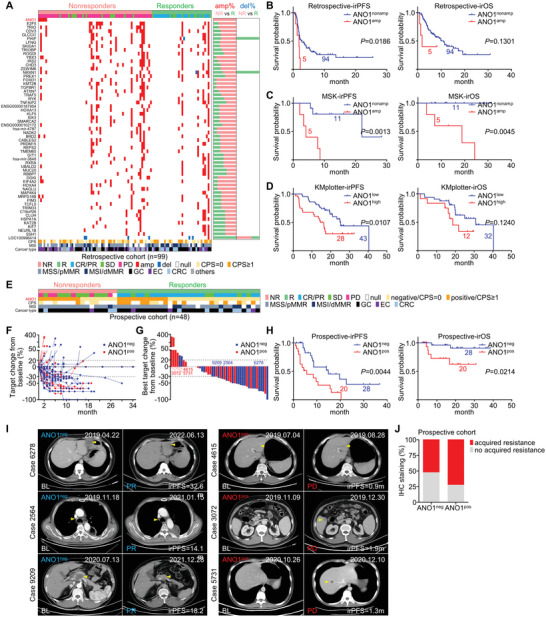
Figure 1.

ANO1 amplification or high‐expression predicts adverse immunotherapeutic outcomes. A) A landscape of CNAs with >5% incident rate in a GI cancer retrospective training cohort received immunotherapy. The irPFS/irOS were stratified by ANO1 amplification for B) training cohort and C) MSK datasets, or stratified by ANO1 expression for D) KMplotter dataset of EC. E) The mutual relationship of response, IHC‐based ANO1 expression, CPS status, MSI status, and cancer types for a GI cancer prospective validating cohort received immunotherapy. F) The dynamic fold changes of target tumor volume from immunotherapy baseline to the end of follow‐up were measured for each patient of the validating cohort. G) The best fold changes of target tumor volume from the maximum tumor reduction to immunotherapy baseline were measured for each patient of the validating cohort. H) The irPFS/irOS for validating cohort were stratified by ANO1 positivity. I) Representative CT images during immunotherapy for patients of validating cohort with characterized ANO1 positivity at baseline. The target tumor measured was marked with arrowheads. J) Comparison of acquired immunotherapeutic resistance between ANO1‐negative and ‐positive responders in the prospective cohort. NR, nonresponder. R, responder. amp, amplification. del, deletion. neg, negative. pos, positive.
