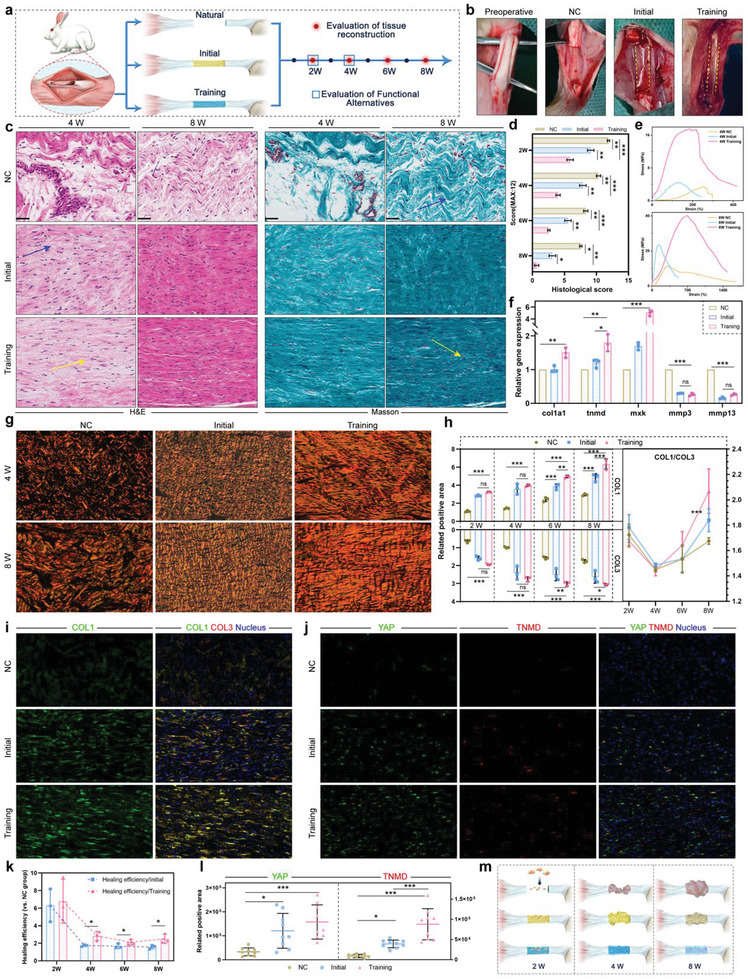
Figure 6.

a) Introduction to in vivo tendon repair experiments. b) Intraoperative images. c) H&E and Masson staining of tendon tissues at four and eight weeks. Blue arrows indicate curved fibers, yellow arrows indicate densely aligned fibers, n = 3. d) Pathological scoring based on H&E and Masson staining. *p < 0.05; **p < 0.01; ***p < 0.001, n = 3. e) Tensile strength of the repaired tendon at four and eight weeks. f) Expression of gene of col1a1, tnmd, mkx, mmp3, and mmp13 in tendon tissue at eight weeks. *p = 0.0107; **p < 0.01; ***p < 0.001, n = 3. g,h) Polarized observation results and statistics of Sirius red staining. *p = 0.0313; **p < 0.01; ***p < 0.001. n = 3. i) Tendon immunofluorescence staining of COL3 (red), COL1 (green), and the nucleus (blue). j) Tendon immunofluorescence staining of YAP (green), TNMD (red), and the nucleus (blue). k) Healing efficiency of training and initial hydrogel (vs NC). *p < 0.05, n = 3. l) Statistics of tendon immunofluorescence staining of YAP and TNMD. *p < 0.05; ***p < 0.001, n = 9. m) Different stages of tendon reconstruction. All scale bars indicate 200 µm.
