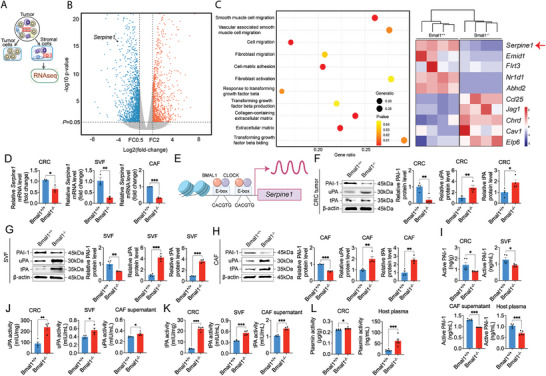
Figure 2.

Bmal1 deficiency augments the PAI‐1‐tPA/uPA‐plasmin axis. A) The stromal vascular fraction (SVF) of CRC tumors grown in Bmal1+/+ and Bmal1−/− mice were isolated by FACS sorting. RNAs were extracted and subjected for sequencing. B) Volcano plot presenting differential gene expression in isolated SVF from Bmal1+/+ versus Bmal1−/− mice. Orange indicates significantly increased genes and blue indicates significantly decreased genes. C) Genome‐wide expression profiling of SVF from Bmal1+/+ and Bmal1−/− tumor tissues (n = 4 samples per group). Serpine1 was identified as one of the highly down regulated genes. D) Quantification of Serpine1 mRNA level in CRC tumors, SVF, and FACS‐isolated FAP+ CAFs from Bmal1+/+ and Bmal1−/− tumors (n = 3 samples per group). E) Schematic diagram of Serpine1 transcription. The Serpine1 is a direct transcriptional target of BMAL1‐CLOCK heterodimers and the Serpine1 gene promoter contained canonical E‐boxes of BMAL1‐CLOCK binding sites. F–H) Relative PAI‐1, uPA, and tPA protein levels and quantification in CRC tumors, SVF, and CAFs from Bmal1+/+ and Bmal1−/− mice (n = 4 samples per group). I) ELISA quantification of active PAI‐1 in CRC tumors, SVF, CAF supernatant and plasma from tumor‐bearing mice (n = 5 samples per group). J,K) Quantification of uPA and tPA activity in CRC tumors, SVF, and CAF supernatant from Bmal1+/+ and Bmal1−/− mice (n = 4 samples per group). L) Quantification of plasmin activity in CRC tumor and plasma from tumor‐bearing mice (n = 6 samples per group). Data presented as mean ± S.E.M. *P < 0.05; **P < 0.01; ***P < 0.001; two‐tailed student t‐test.
