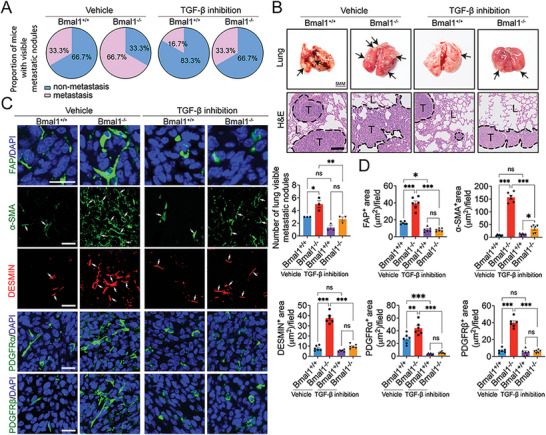
Figure 7.

Anti‐metastatic effects of TGF‐β inhibitors in Bmal1−/− mice. A) Quantification of visible metastases on the surface of lungs in vehicle‐ and SB‐431542‐treated tumors grown in Bmal1+/+ and Bmal1−/− mice (n = 6 mice per group). B) Gross examination and H&E staining of lungs in vehicle‐ and SB‐431542‐treated CRC tumors grown in Bmal1+/+ and Bmal1−/− mice. Apparent CRC metastatic nodules are indicated by arrows (scale bar = 5 mm). Quantification of visible metastatic nodules by H&E staining (n = 3 random fields per group). Dashed lines encircle cancer metastases. T = tumor; L = lung (scale bar = 100 µm). C) Representative micrographs of immunohistochemical staining of lung metastasis nodules of vehicle‐ and SB‐431542‐treated tumor in Bmal1+/+ and Bmal1−/− mice with fibroblast markers: FAP (green); α‐SMA (green) plus CD31 (red); DESMIN (red) plus ENDOMUCIN (green); PDGFRα (green); and PDGFRβ (green). D) Quantification of FAP+, α‐SMA+, DESMIN+, PDGFRα +, and PDGFRβ + signals (n = 6 random fields per group). Data presented as mean ± S.E.M. *P < 0.05; **P < 0.01; ***P < 0.001, ns = not significant; two‐tailed student t‐test and one‐way ANOVA. Scale bar = 50 µm.
