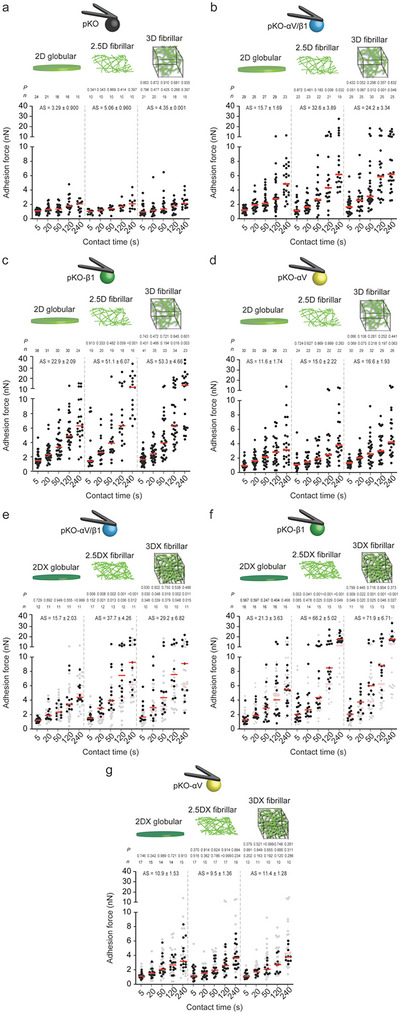
Figure 2.

Fibroblasts employ α5β1 integrin to differentiate between globular FN substrates, fibrillar FN matrices, and stiffened fibrillar FN matrices to strengthen adhesion faster. a–d) Adhesion forces of pan‐integrin‐null (pKO) fibroblasts expressing no FN‐binding integrins (a), pKO fibroblasts expressing α5β1 and αVβ3 integrins (pKO‐αV/β1) (b), pKO fibroblasts expressing α5β1 integrin (pKO‐β1) (c) or pKO fibroblasts expressing αVβ3 integrin (pKO‐αV) to 2D globular FN substrates, 2.5D fibrillar FN matrices, and 3D fibrillar FN matrices at given contact times (d). Dots represent adhesion forces of individual fibroblasts and red bars the median. n indicates the number of fibroblasts tested. Lower p values compare 2.5D fibrillar or 3D fibrillar FN matrices with 2D globular FN substrates. Upper p values compare 2.5D fibrillar with 3D fibrillar FN matrices. e–g), Adhesion forces of pKO‐αV/β1 (e), pKO‐β1 (f), or pKO‐αV (g) fibroblasts to PFA‐crosslinked 2D (2DX) globular FN substrates, PFA‐crosslinked 2.5D (2.5DX) fibrillar FN matrices, and PFA‐crosslinked 3D (3DX) fibrillar FN matrices at given contact times. Data representation as in (a–d). For reference adhesion forces of fibroblasts to respective non‐crosslinked FN substrates or matrices are given in gray. Bottom p values compare given adhesion forces with reference data. Middle p values compare 2.5DX fibrillar or 3DX fibrillar FN matrices with 2DX globular FN substrates. Upper p values compare 2.5DX fibrillar with 3DX fibrillar FN matrices. P values were calculated using two‐tailed Mann–Whitney test. AS indicates the slope of a linear regression and s.e. of the adhesion strengthening rate (pN s−1). n indicates the number of individual fibroblasts tested.
