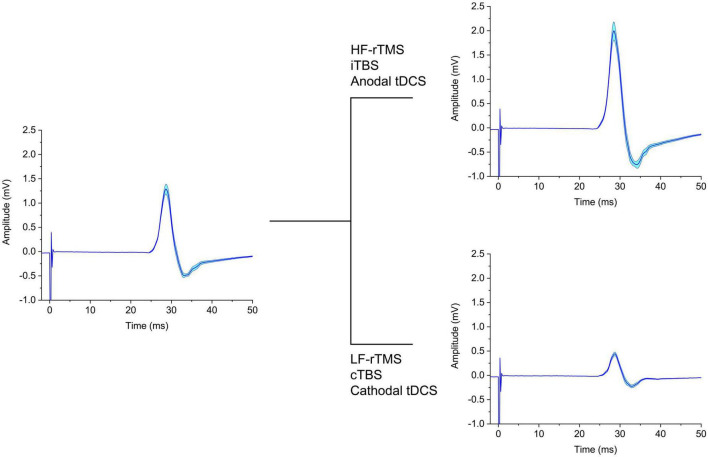
FIGURE 1.
Schematic representation of the effect on MEP of different neuromodulatory techniques. The left panel depicts baseline MEPs, which are either increased (upper right panel) or decreased (lower right panel) in amplitude by the NIBS protocols indicated. tDCS, transcranial direct current stimulation; cTBS, continuous theta-burst stimulation; iTBS, intermittent theta-burst stimulation; HF-rTMS, high-frequency repetitive transcranial magnetic stimulation; LF-rTMS, low-frequency repetitive transcranial magnetic stimulation.

