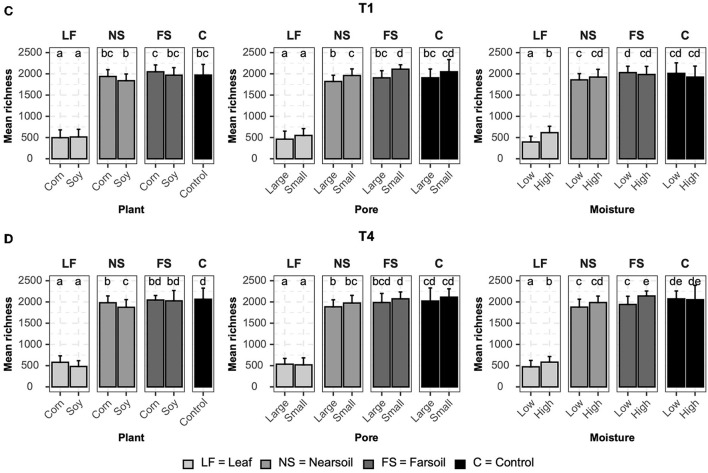
Figure 5.
Bar plots showing significant differences (P ≤ 0.05 after the Benjamini-Hochberg correction method) in the mean observed species richness (±standard deviation) for bacterial microbiomes in (A) conventional (T1) and (B) organic (T4) managament samples. Samples were grouped according to treatment, and statistical differences were calculated across niche factors (leaf, near soil, far soil, and control) using pairwise Wilcoxon tests.

